Dashboard home
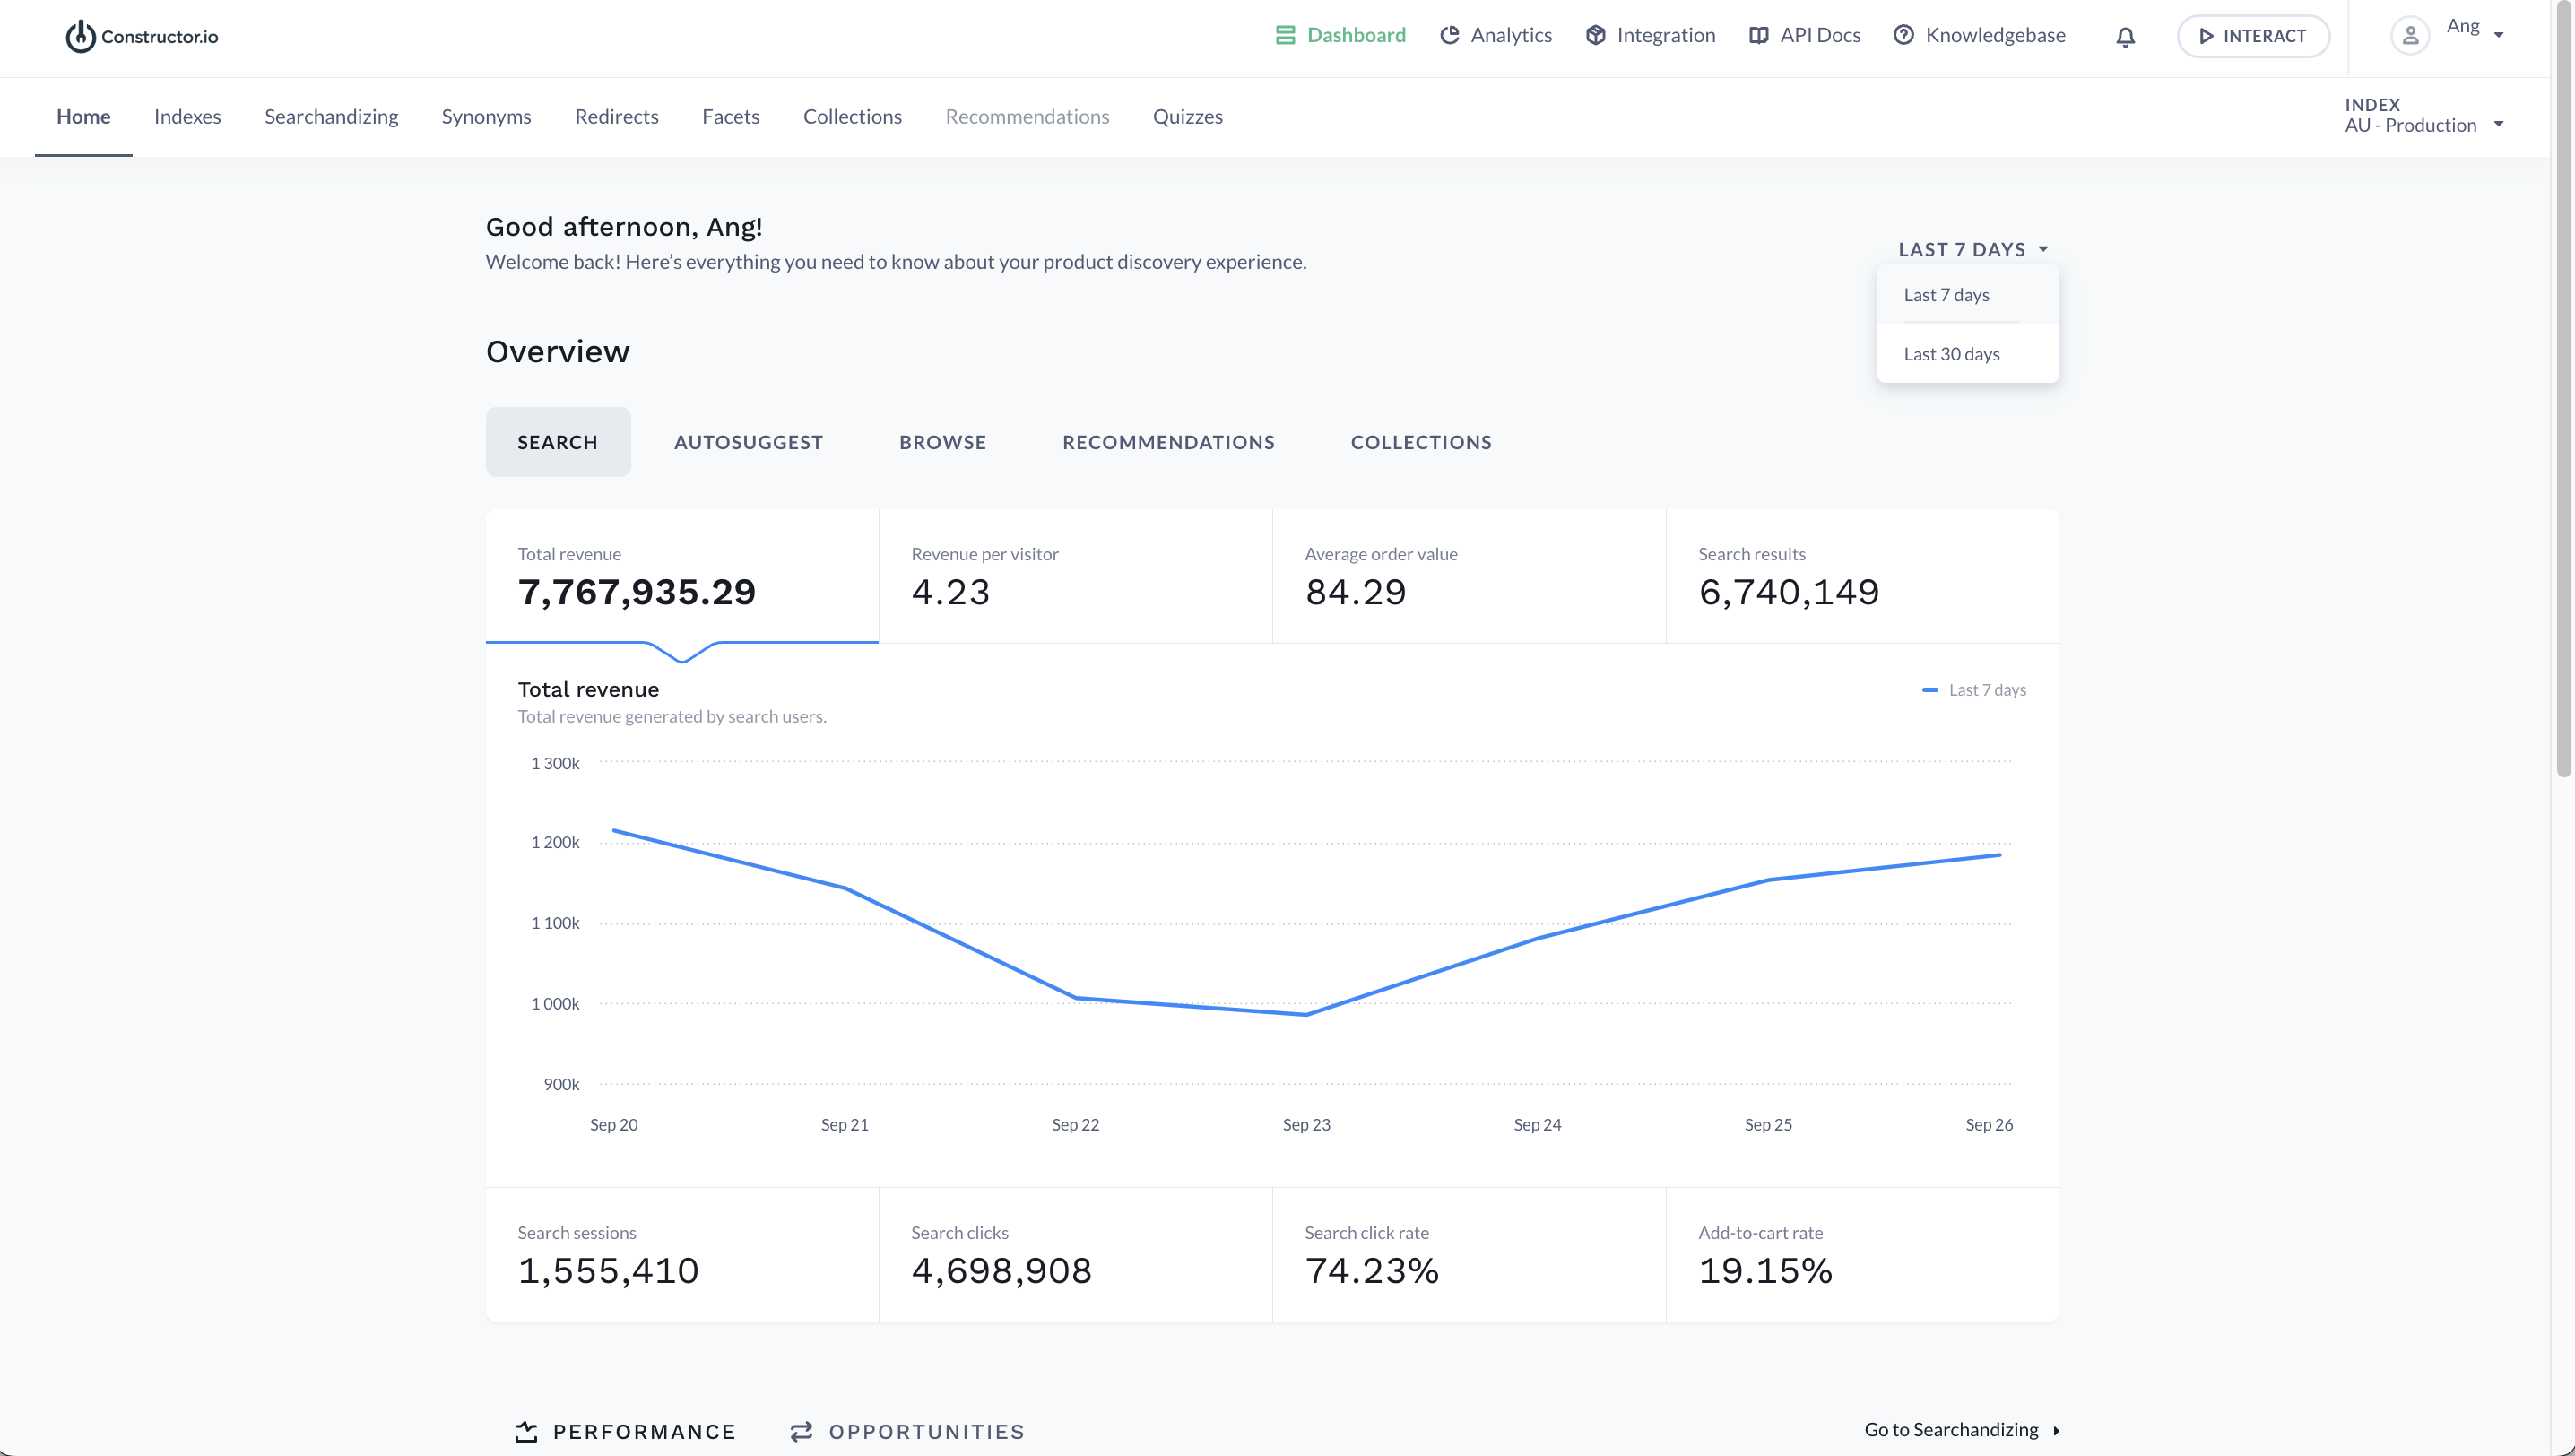
The Home Dashboard is the introductory page of the Constructor product discovery experience. You can see an overview of the Search, Autosuggest, Browse, Recommendations and Collections analytics.
By default, the analytics graph will display the Search Overview analytics graph from the last 7 days. Click on the arrow down icon towards the top right to select the last 30 days.

Constructor dashboard home view - search
Click on the Autosuggest, Browse, Recommendations or Collections tab to see each components analytics graph over the selected time period.
The tabs will show various useful information such as Number of Sessions, Results, Clicks, Views, Impressions, Add to Cart Rate and Click Through Rate.
Constructor dashboard home view - autosuggest
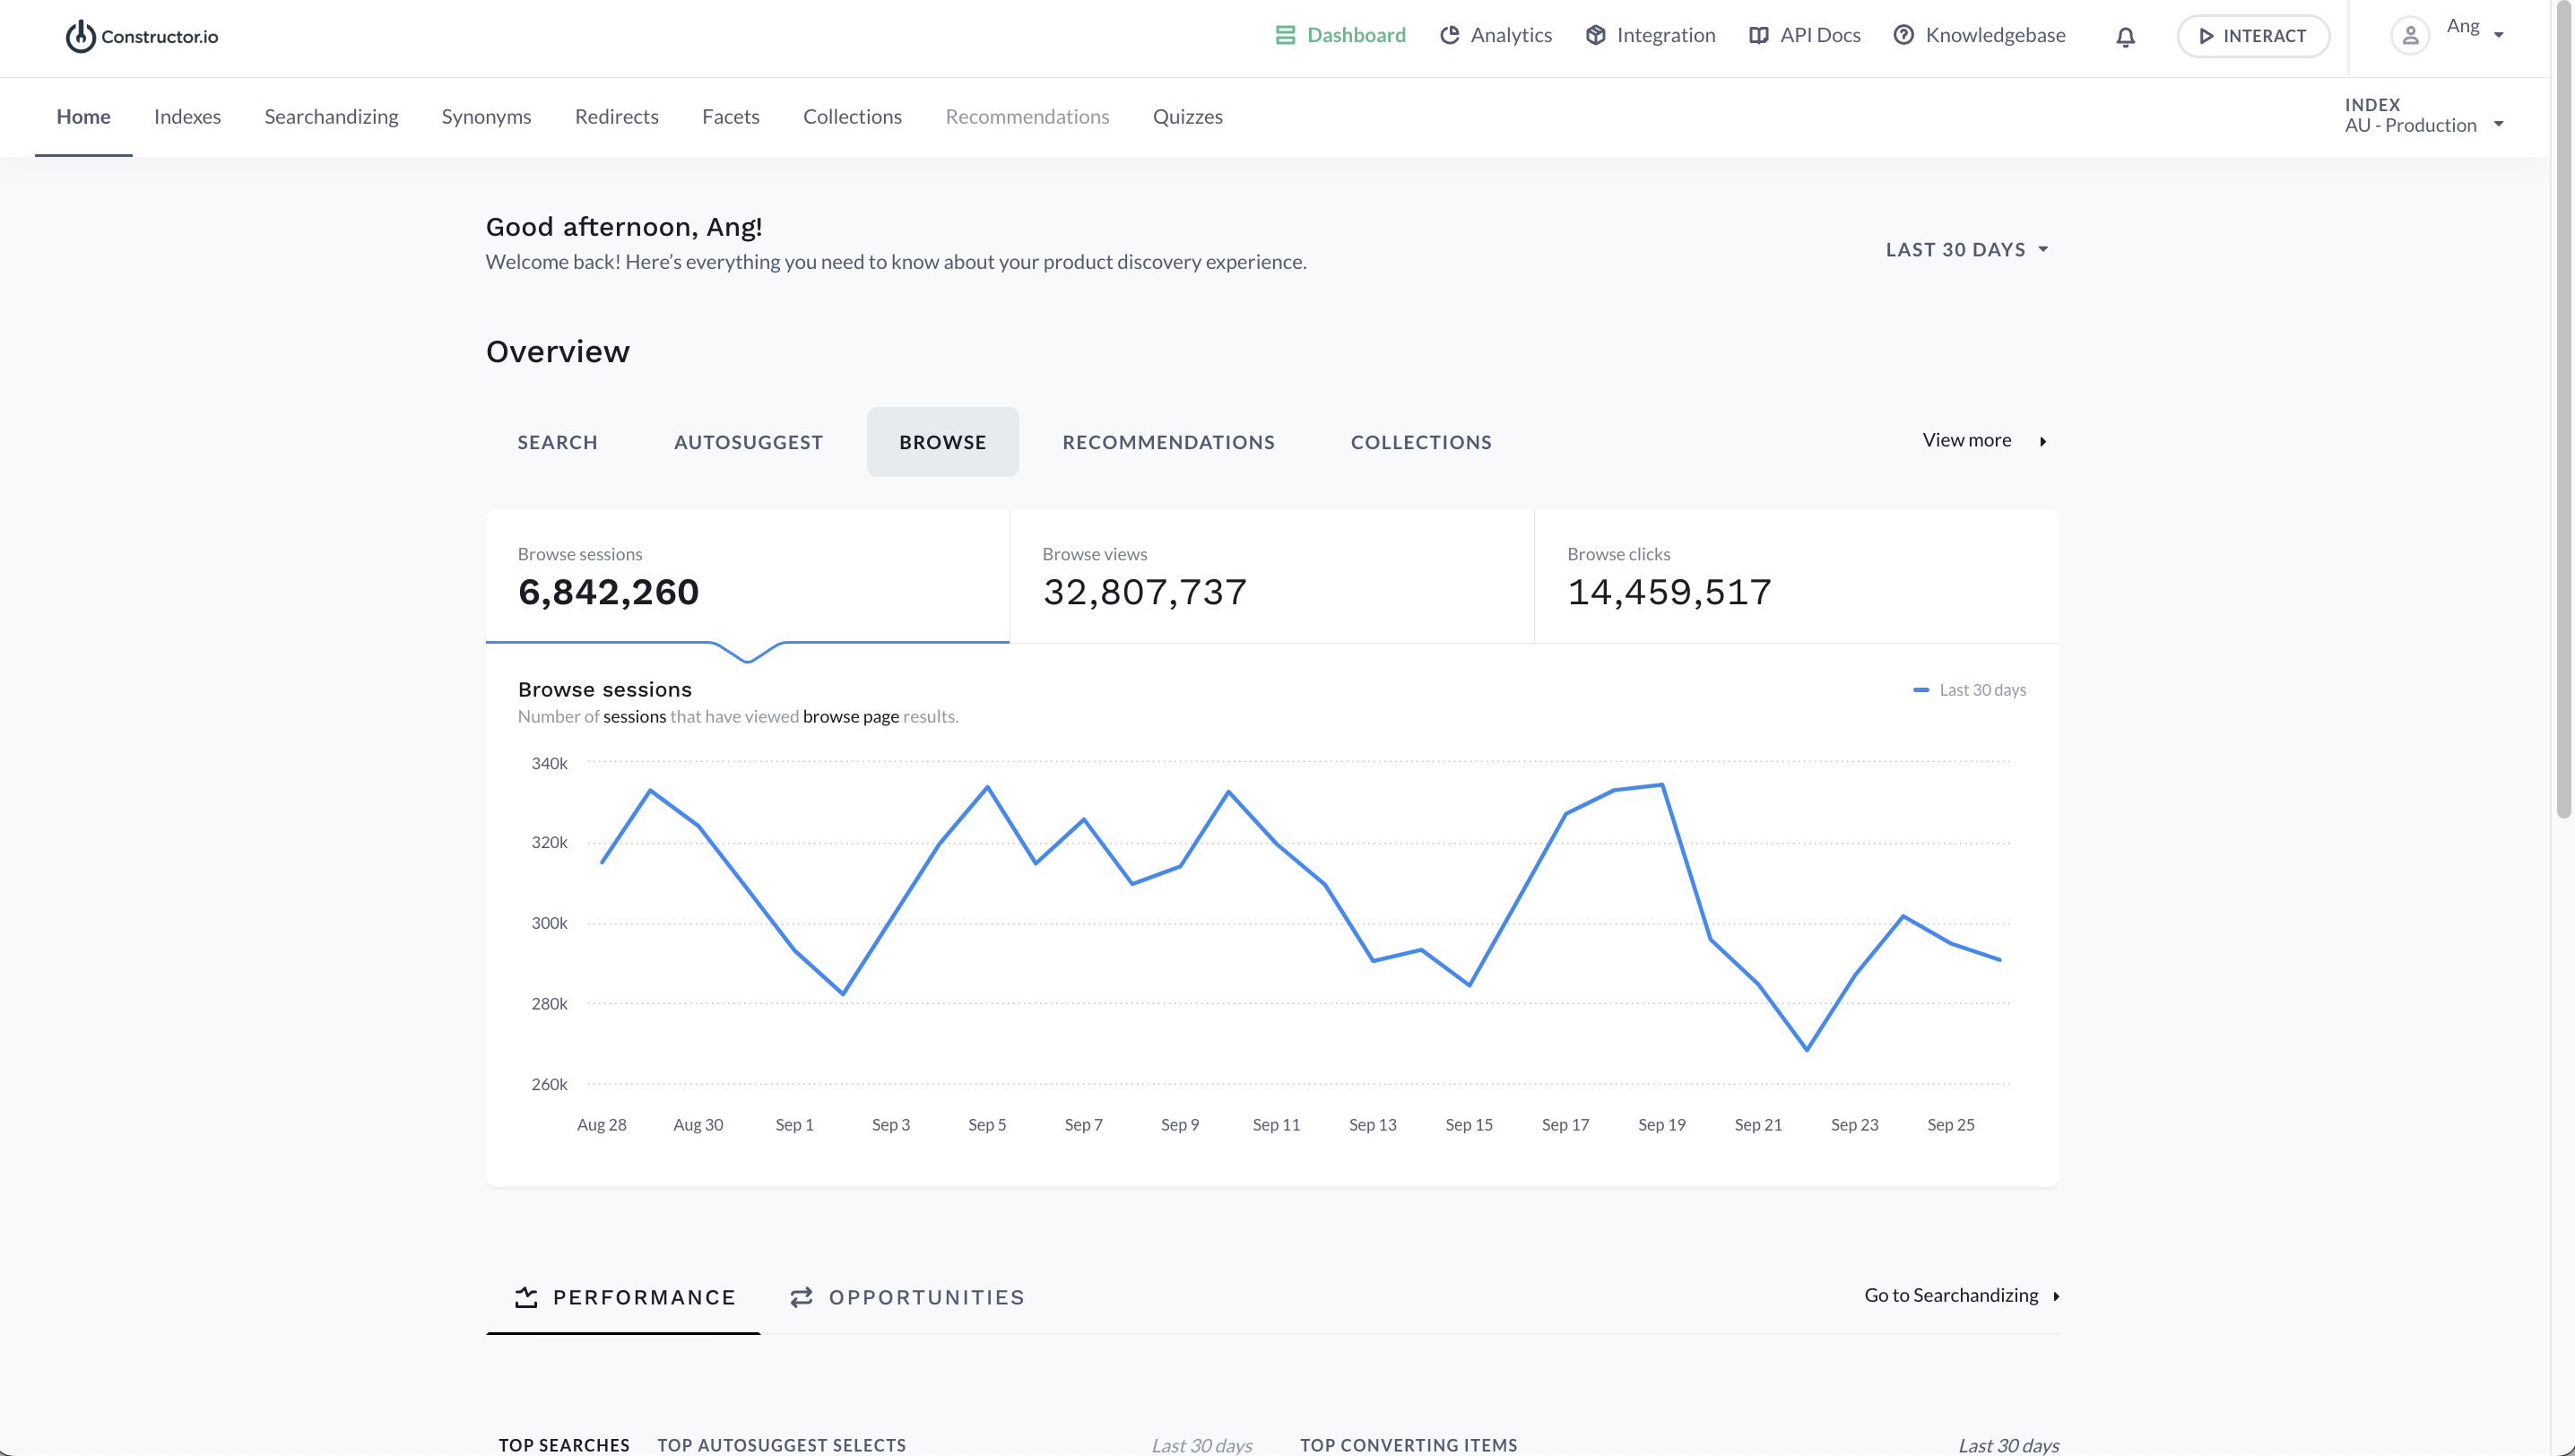
Constructor dashboard home view - browse
If there is no data on the analytics graphs, you are not licensed for that particular component. Get in contact with your Customer Success Manager for more information.
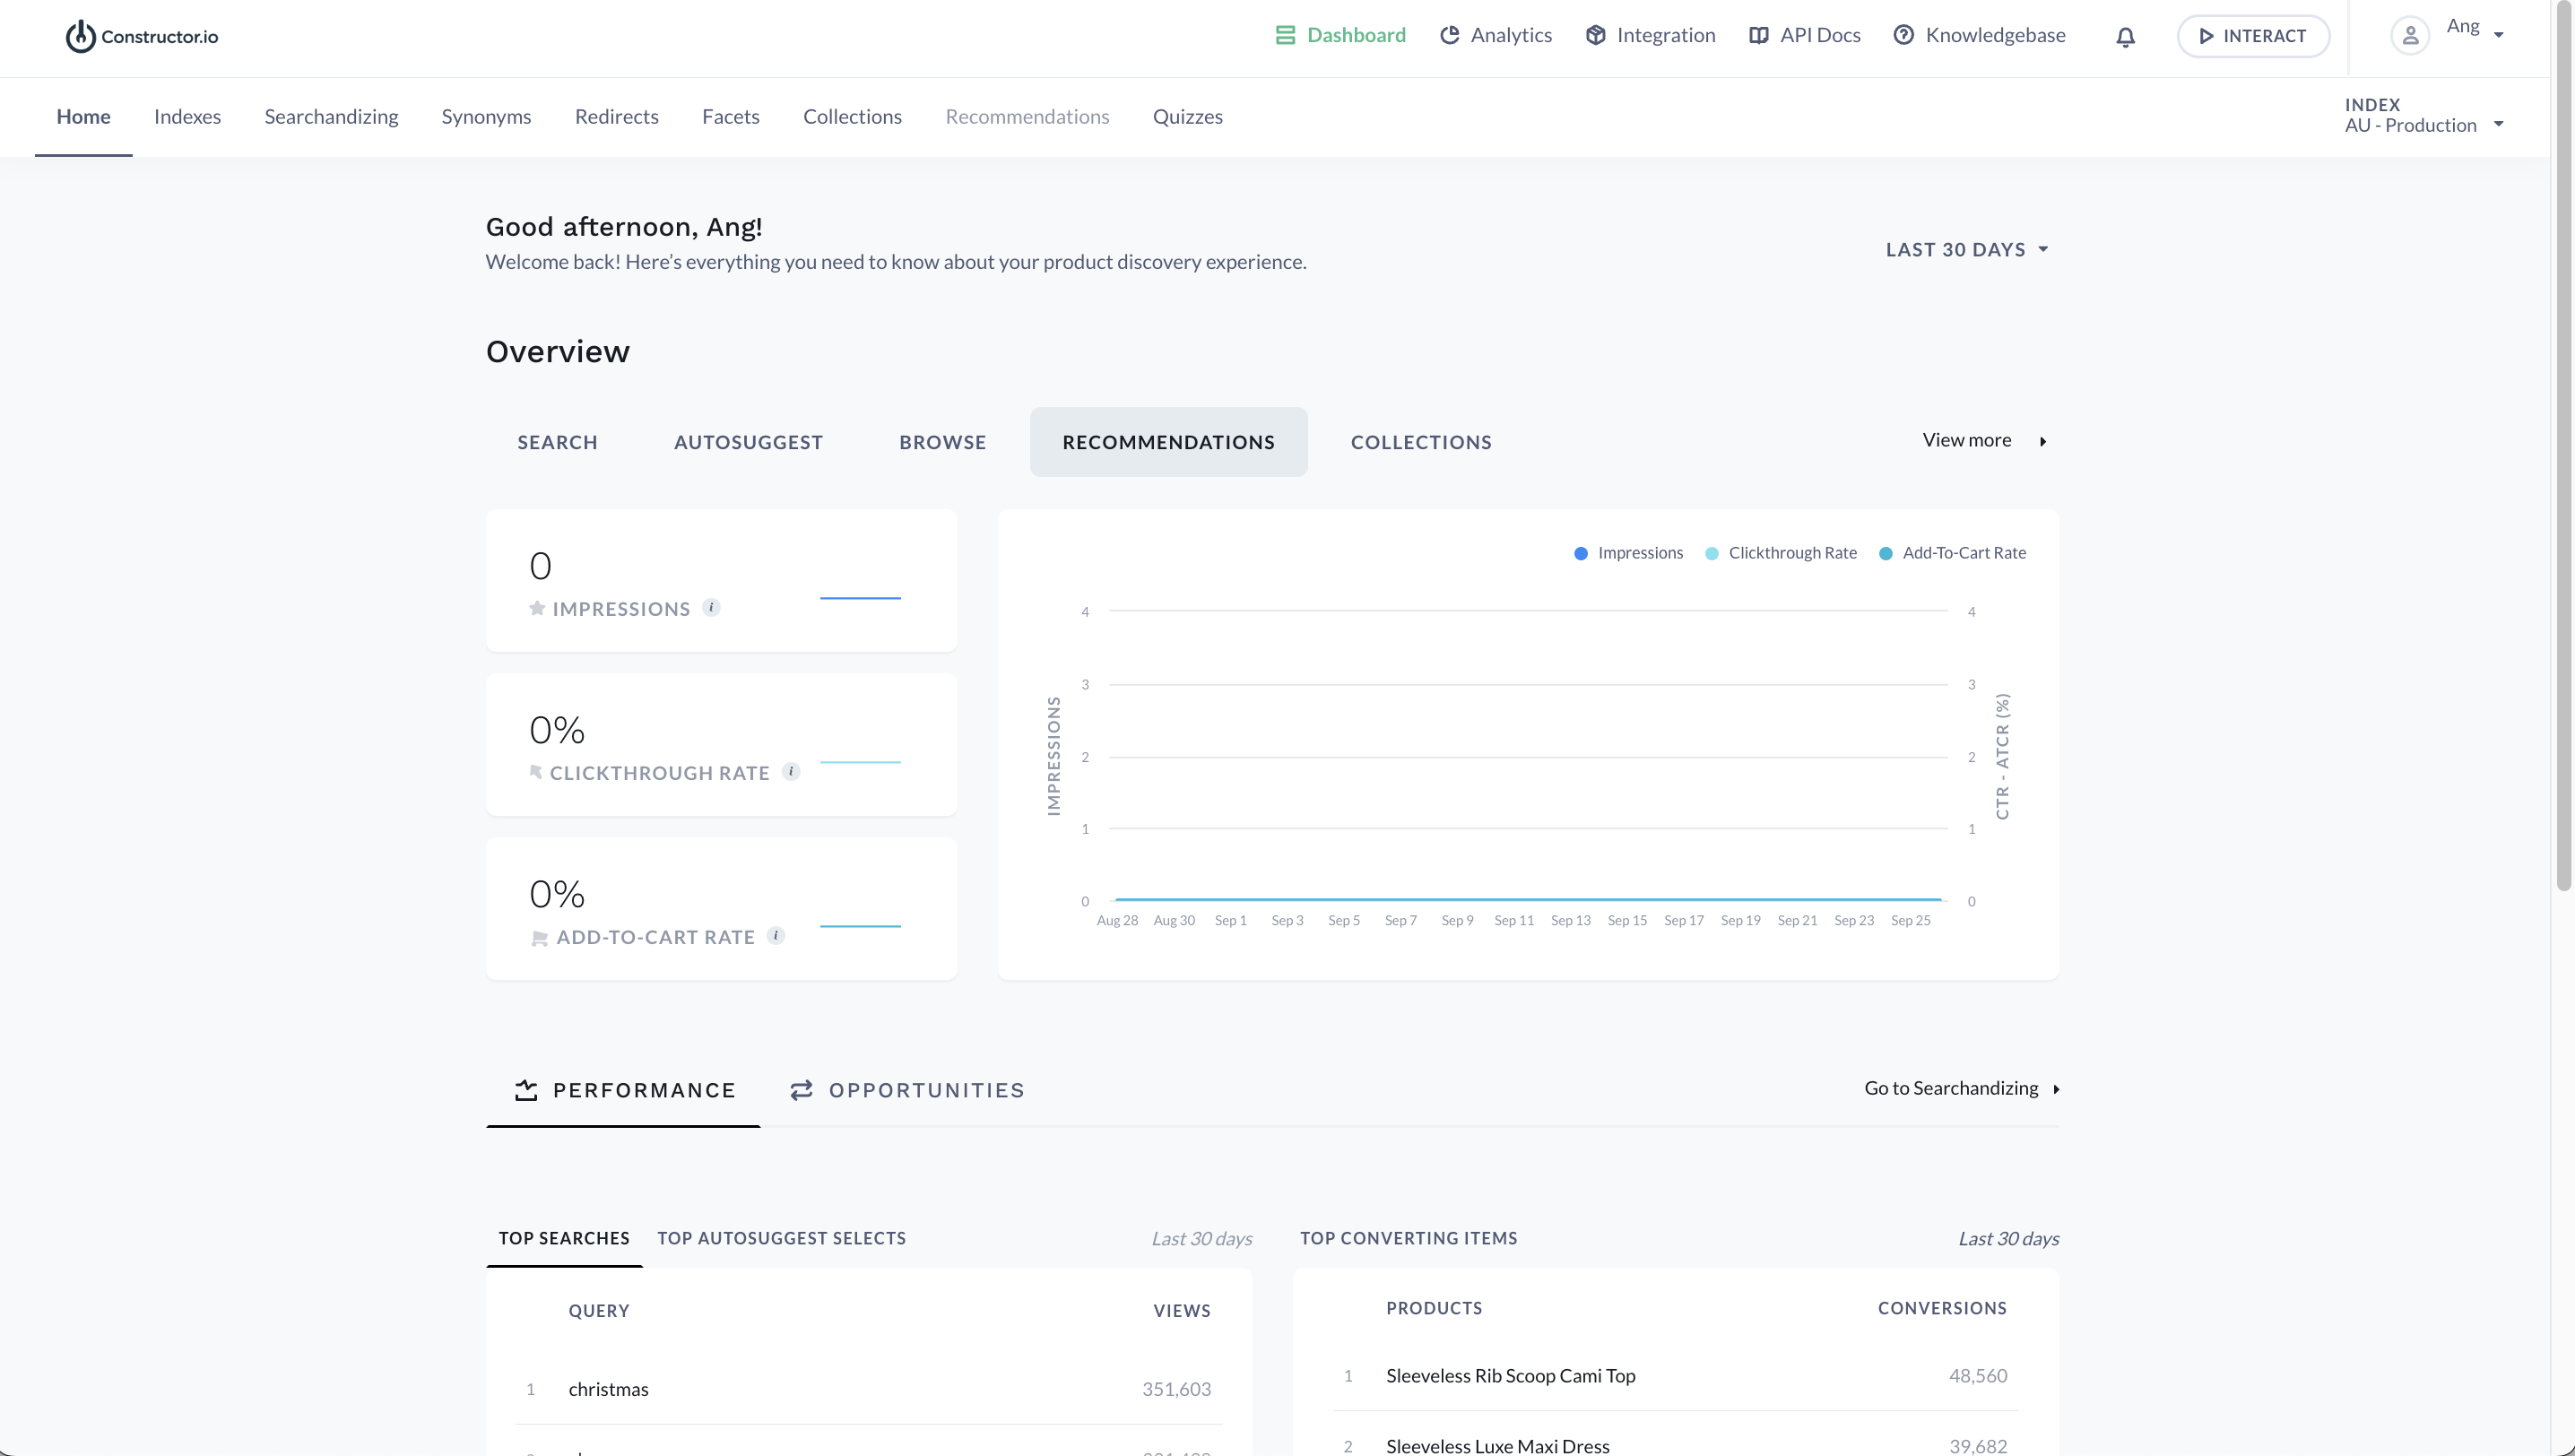
Constructor dashboard home view - recommendations
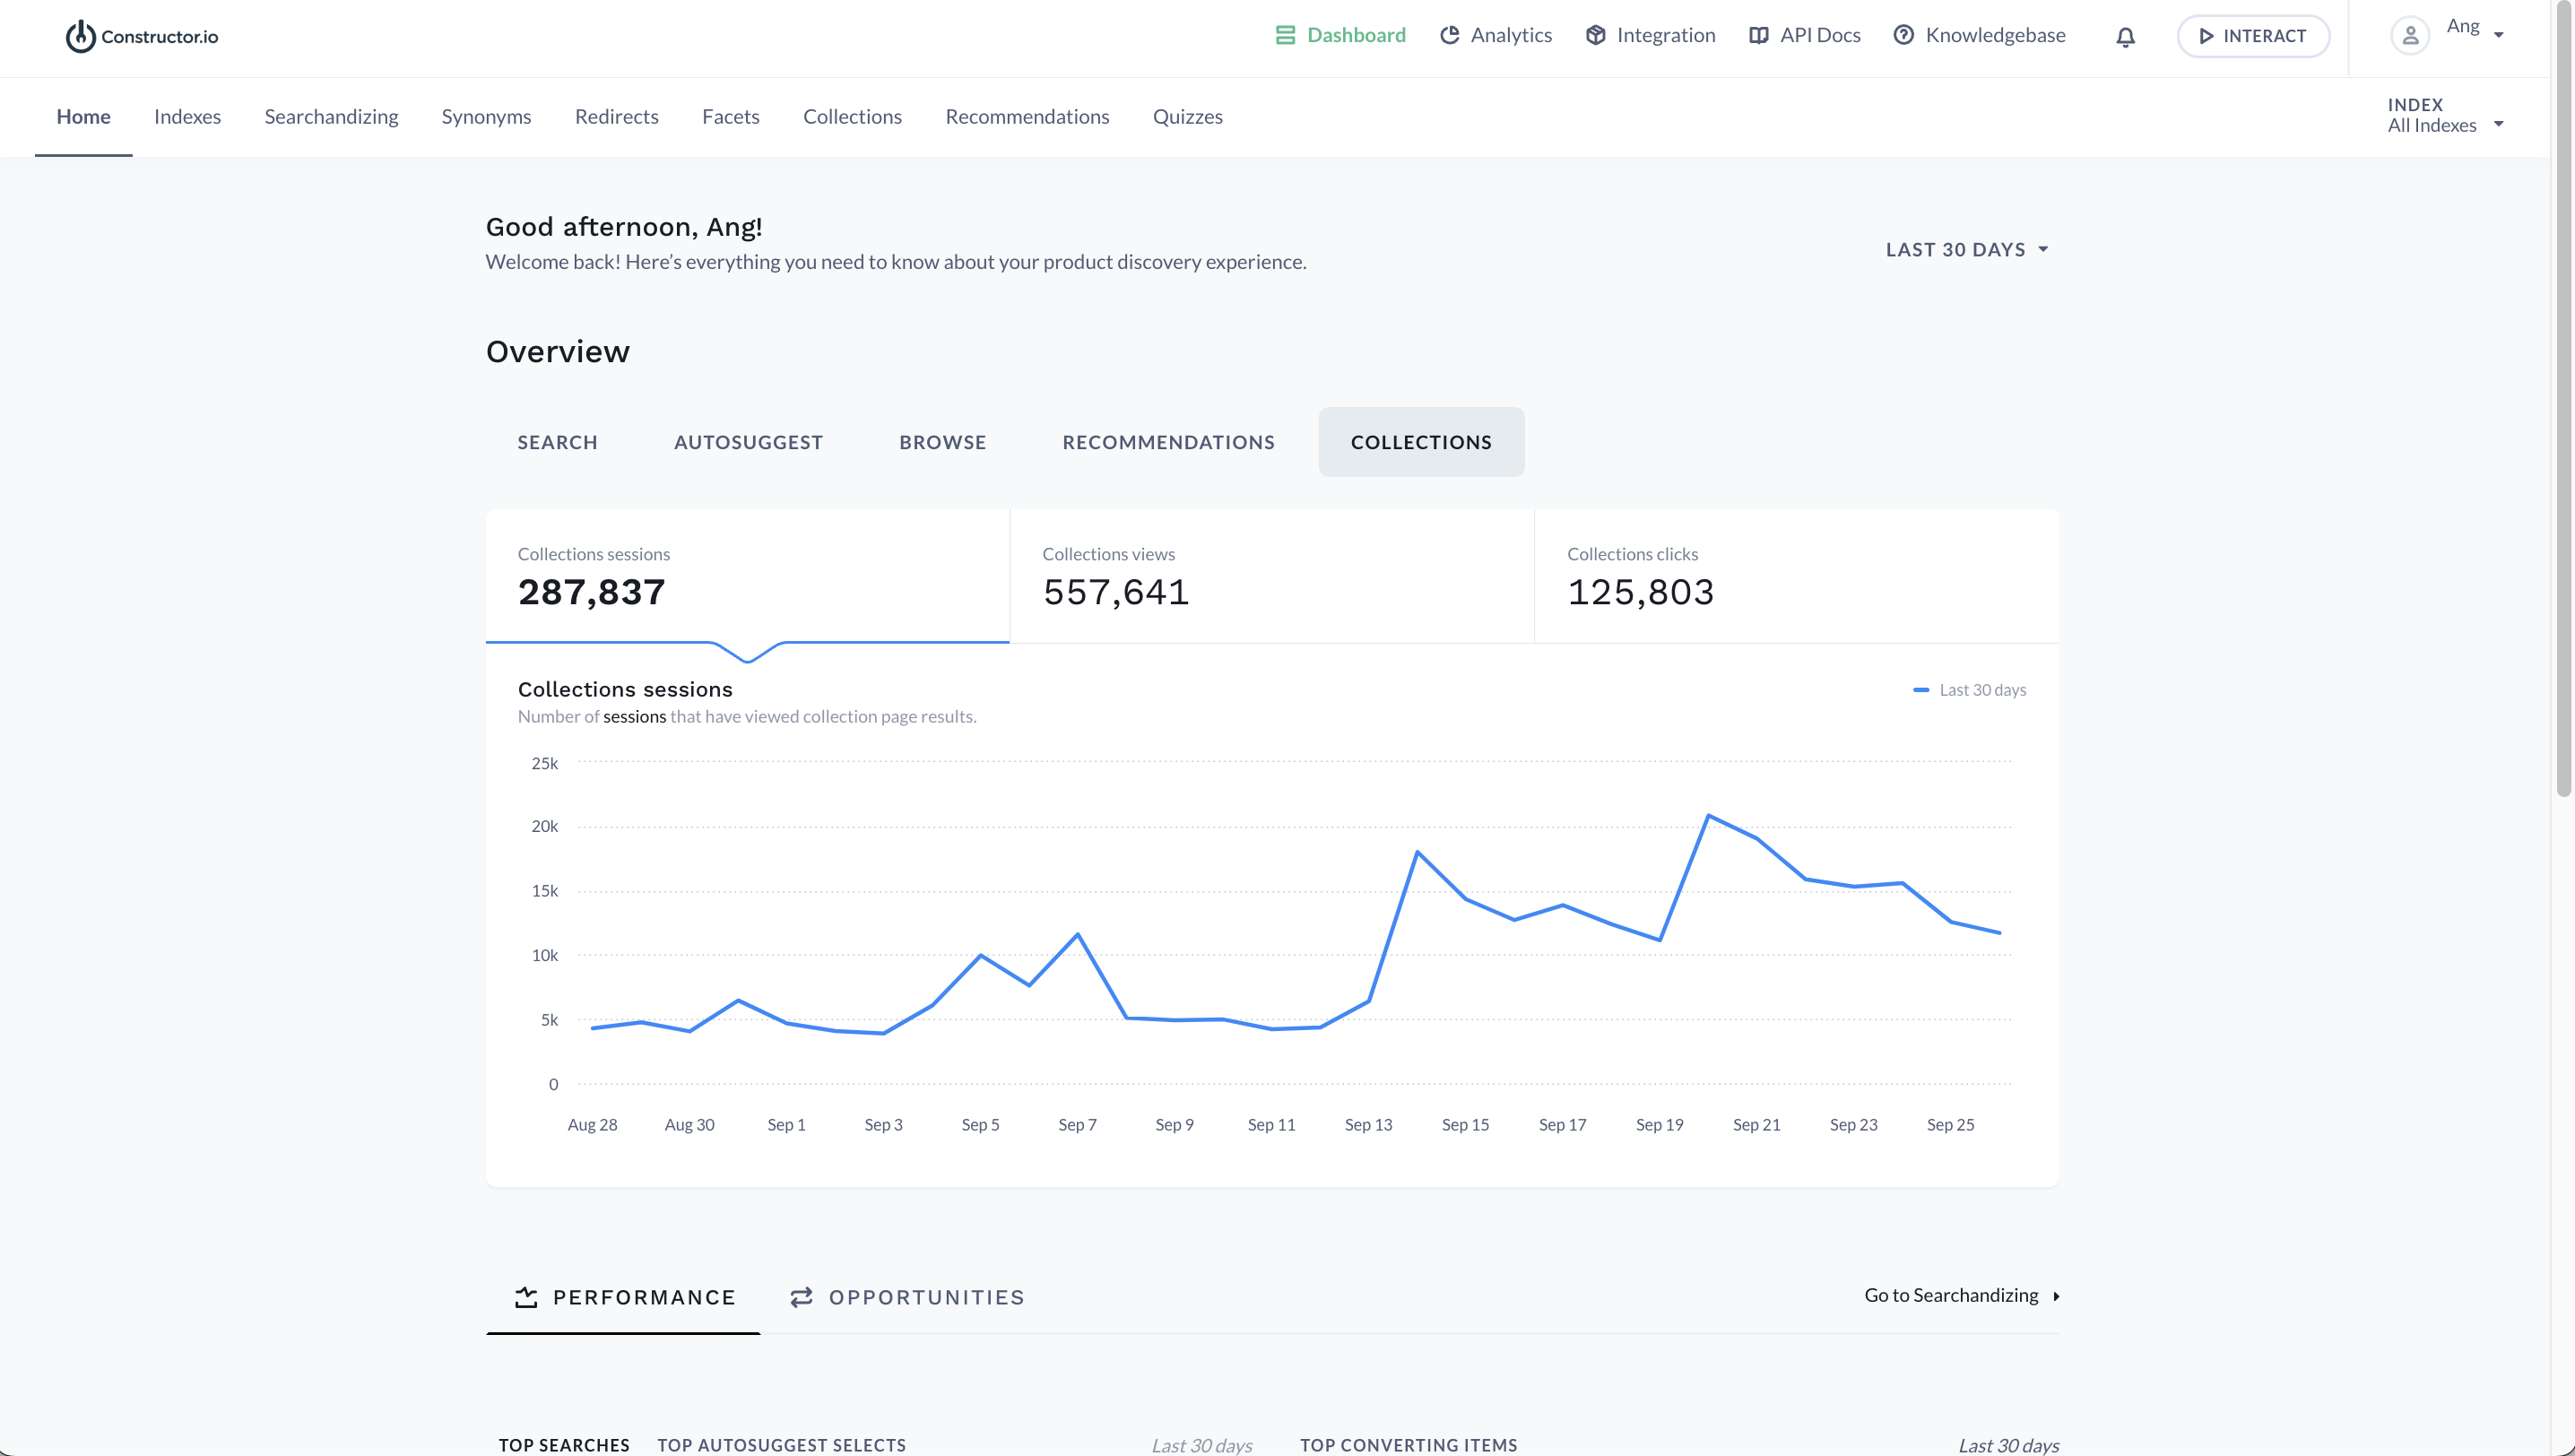
Constructor dashboard home view - collections
Scroll down towards the bottom of the Home Dashboard, there are 2 additional tabs - Performance and Opportunities.
Performance
The performance tab will show a quick summary of your Top 10 Searches, Top 10 Autosuggest Selects and Top 10 Converting Items for the selected time period.
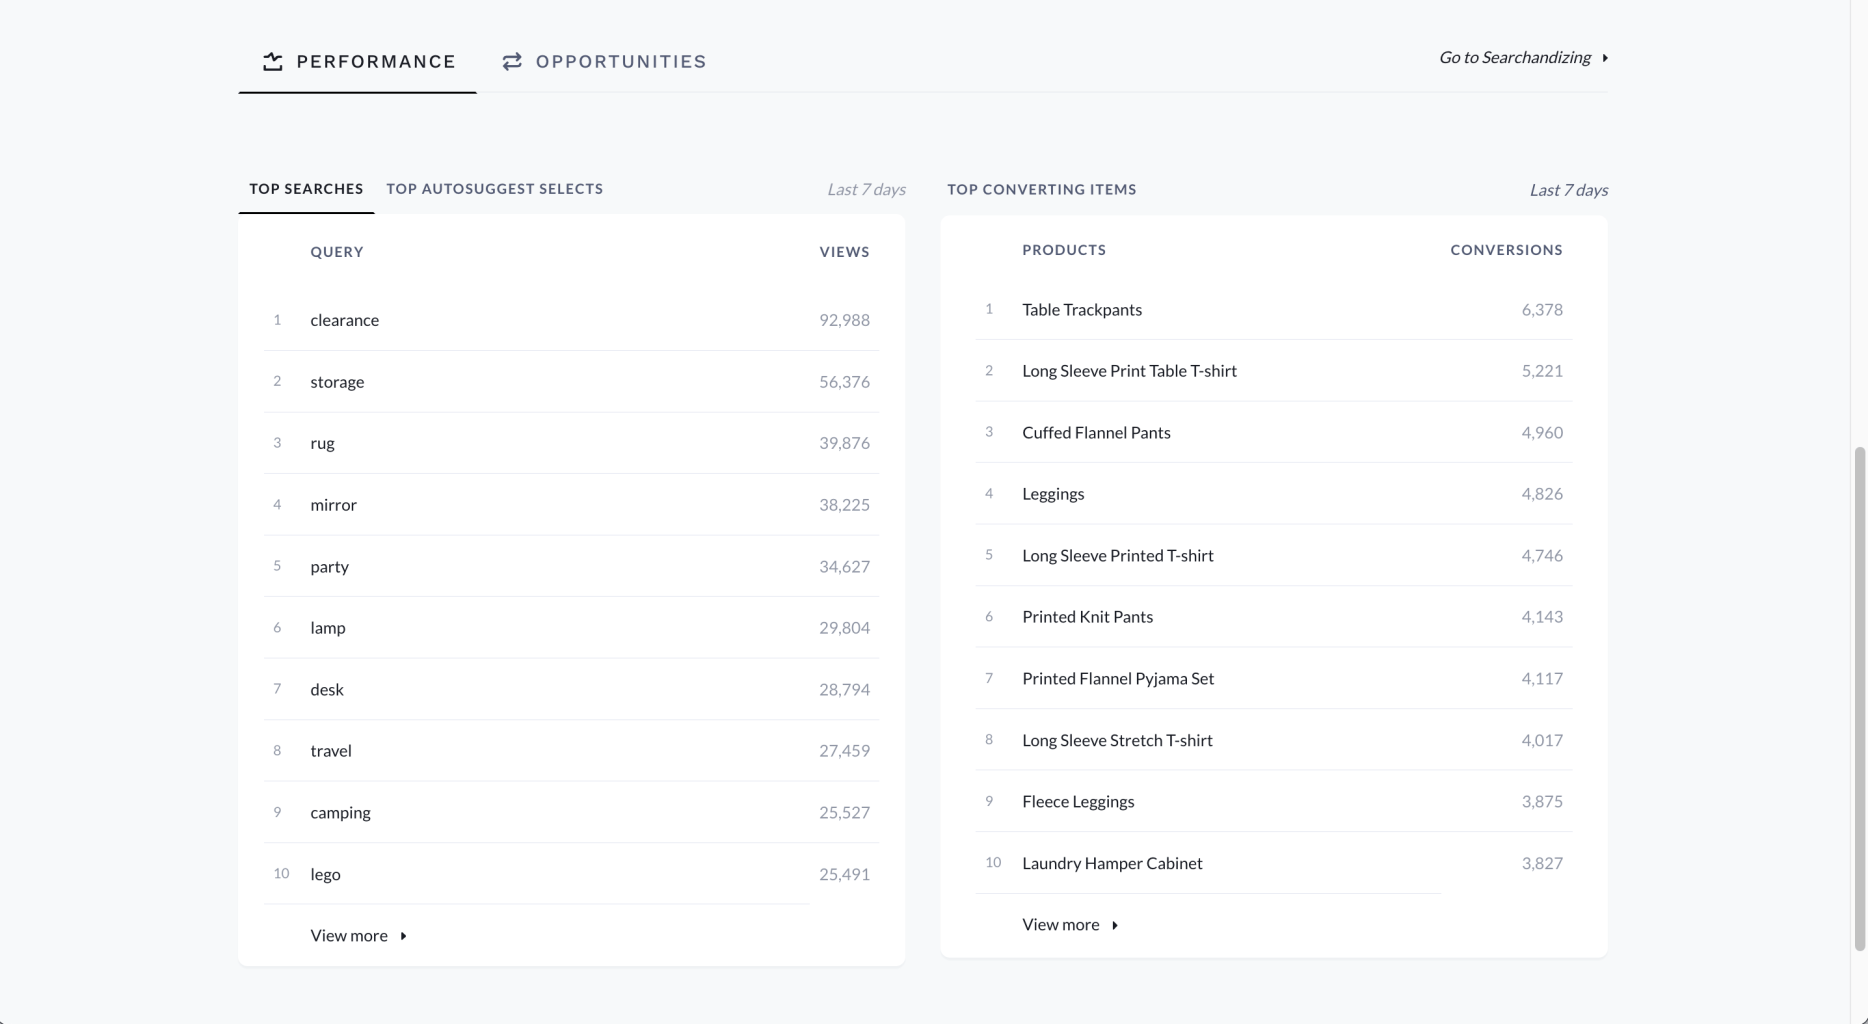
Constructor dashboard home view - performance
Opportunities
The opportunities tab will show a quick summary of where things could possibly be improved. The Zero Results tab on the right-hand side will display queries that are returning zero results, these could be improved by adding appropriate Synonyms.
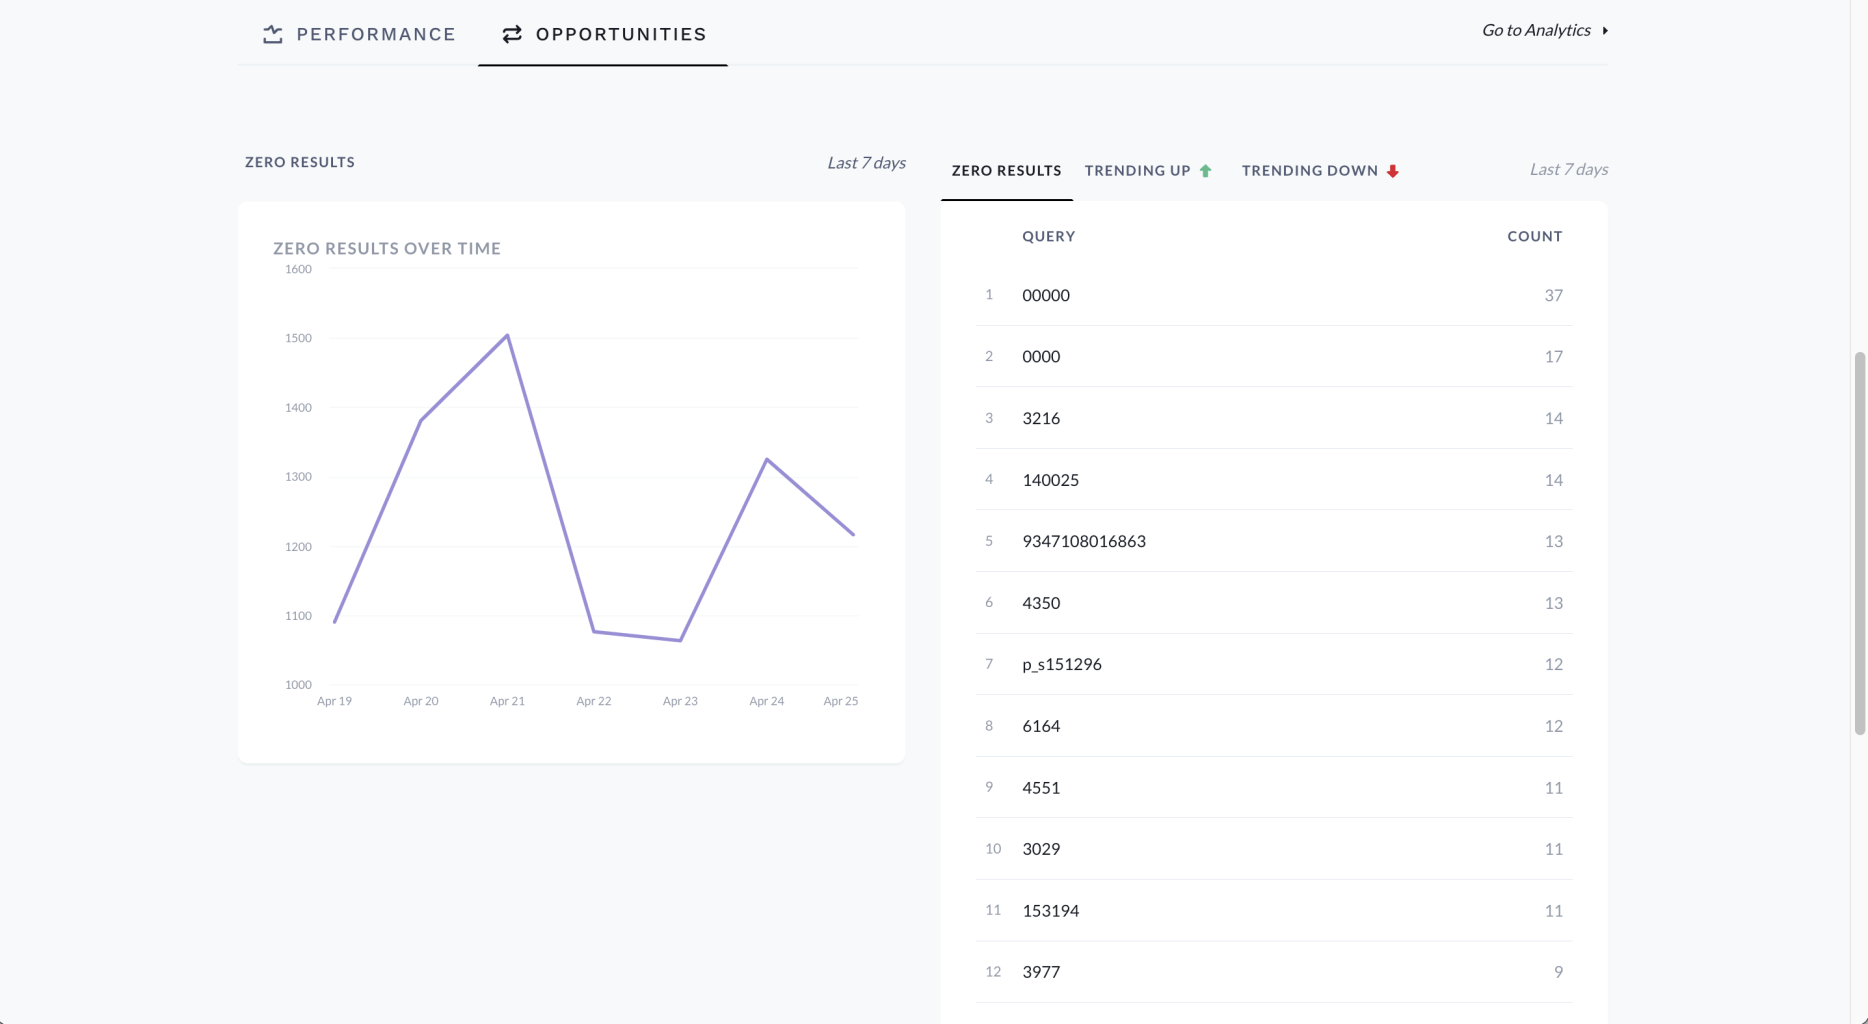
Constructor dashboard home view - opportunities
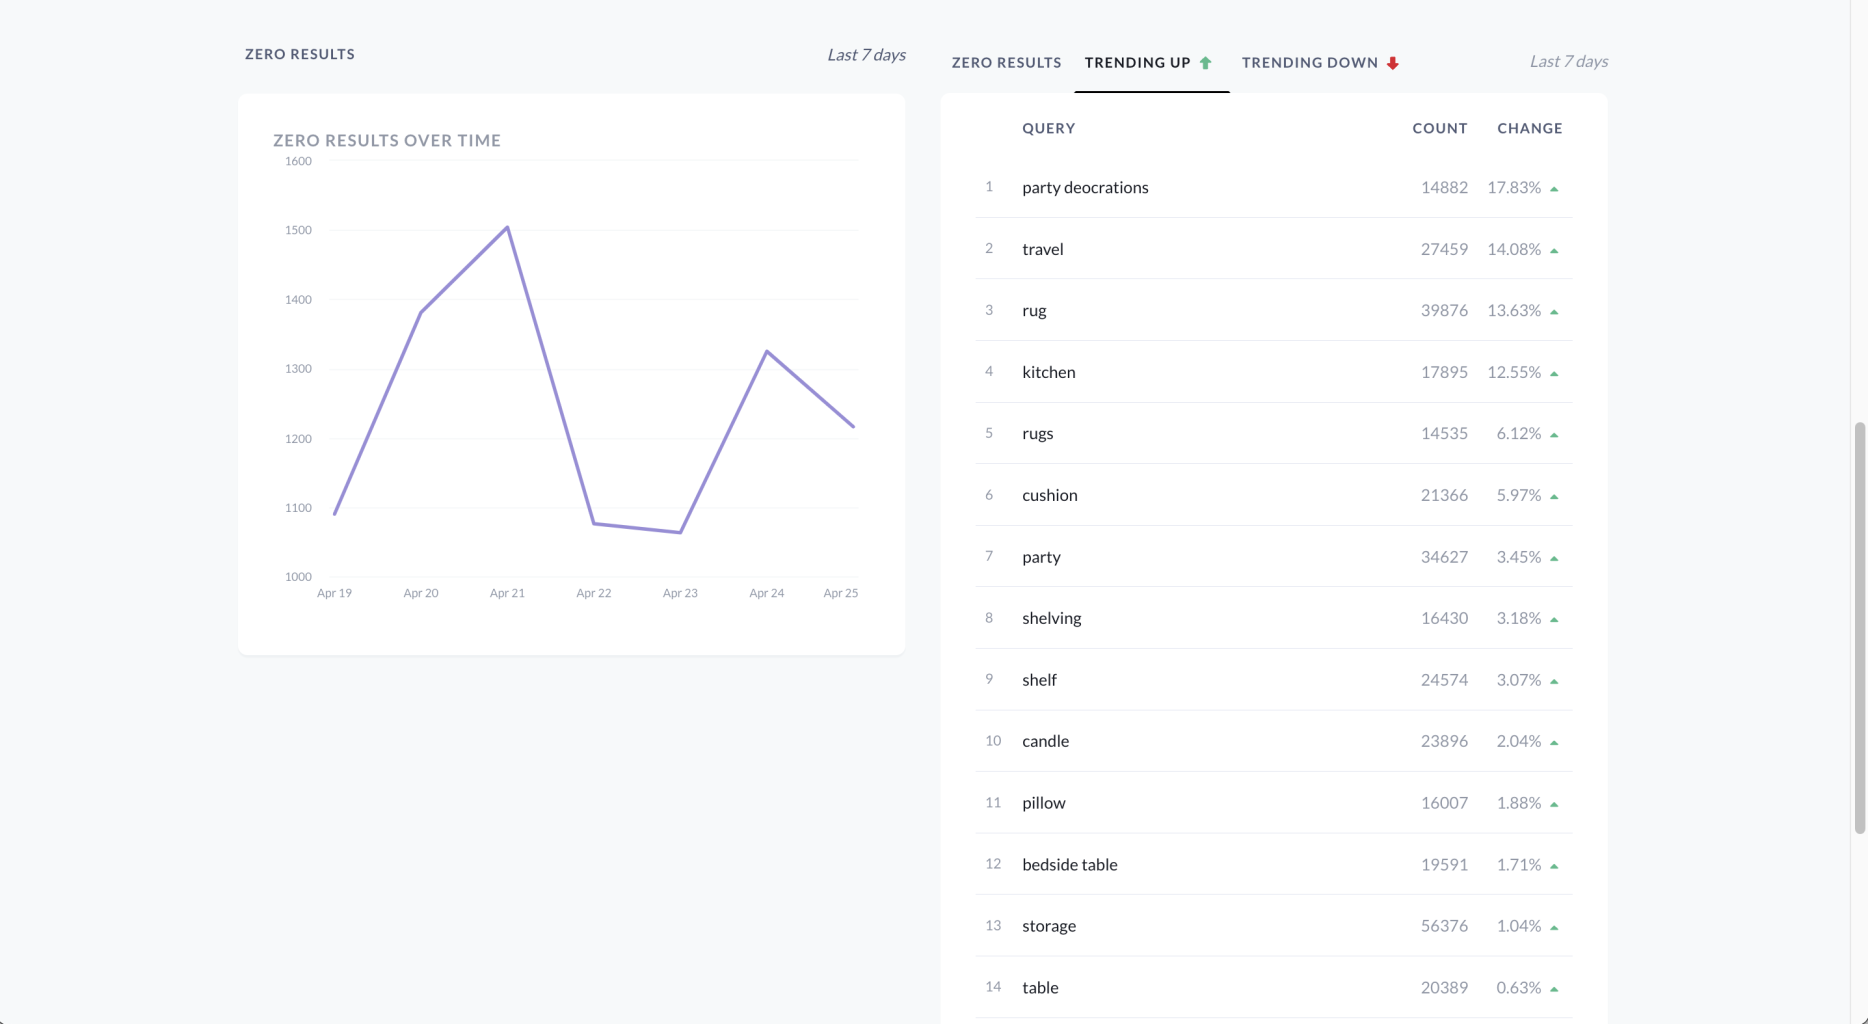
Trending up or Trending down analytics could be an ideal situation to Searchandise to improve the product discovery experience.
Updated 6 months ago