
Overview
The Rule Performance Overview tab provides a high-level summary of how merchandising rules are affecting key product discovery metrics (e.g., purchases, clicks, add-to-carts). At a glance, this tab can help merchandisers answer the question, "Are our rules helping or hurting?"
Rule types included in the summary are slot, boost, and bury rules on specific results page. Global rules and other rule types (e.g., content, variation slicing, allowlist, etc.) are not included.
Navigate to Rule Performance Overview
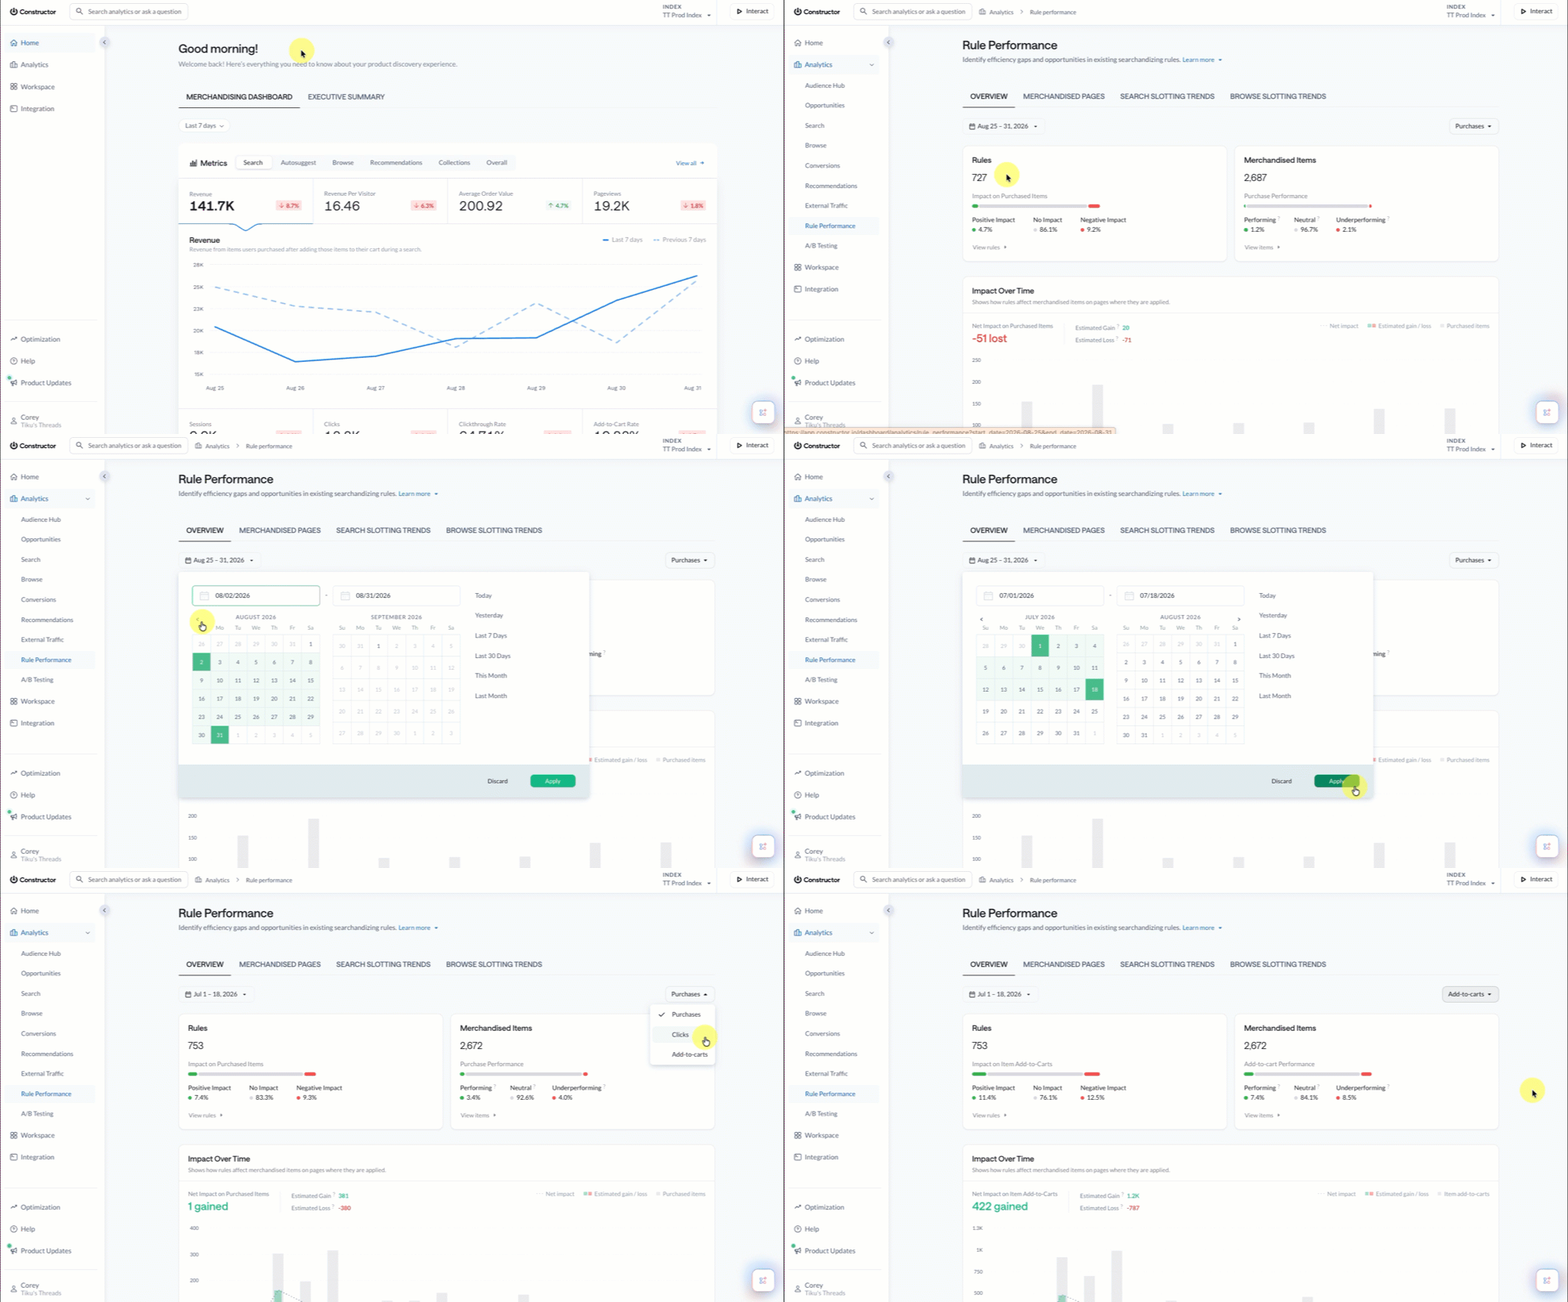
- Select Analytics in the side menu of the Constructor dashboard, then select Rule Performance. The default view is the Overview tab.
- Select the desired date range using the Date drop-down beneath the tab name. You can select a predefined range (e.g., Last 30 days, Last Month, etc.), enter dates manually, or select dates in the calendar view. Page defaults to Last 7 days.
- Select the desired metric from the drop-down on the right side of the page. Options include Purchases, Clicks, and Add-to-carts.
Graphs and table data automatically refresh to reflect the selected date range and metric.
Rules summary
The Rules summary card shows the total number of active merchandising rules across search, category, collection, and facet pages, broken down by their impact on the selected metric.
Included in the count is every rule that was active at least once during the selected date range. If a rule was changed during the selected date range, then estimated gains or losses since the last update are included.
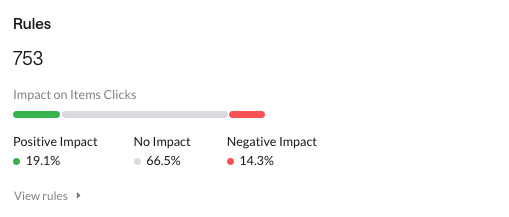
- Positive Impact: Percentage of rules associated with an estimated gain for the metric.
- No Impact: Percentage of rules that had no estimated impact.
- Negative Impact: Percentage of rules associated with an estimated loss.
View and edit rules
You can select View rules in the bottom-left corner of the Rules summary card to launch a detailed list of every rule included in the summary.
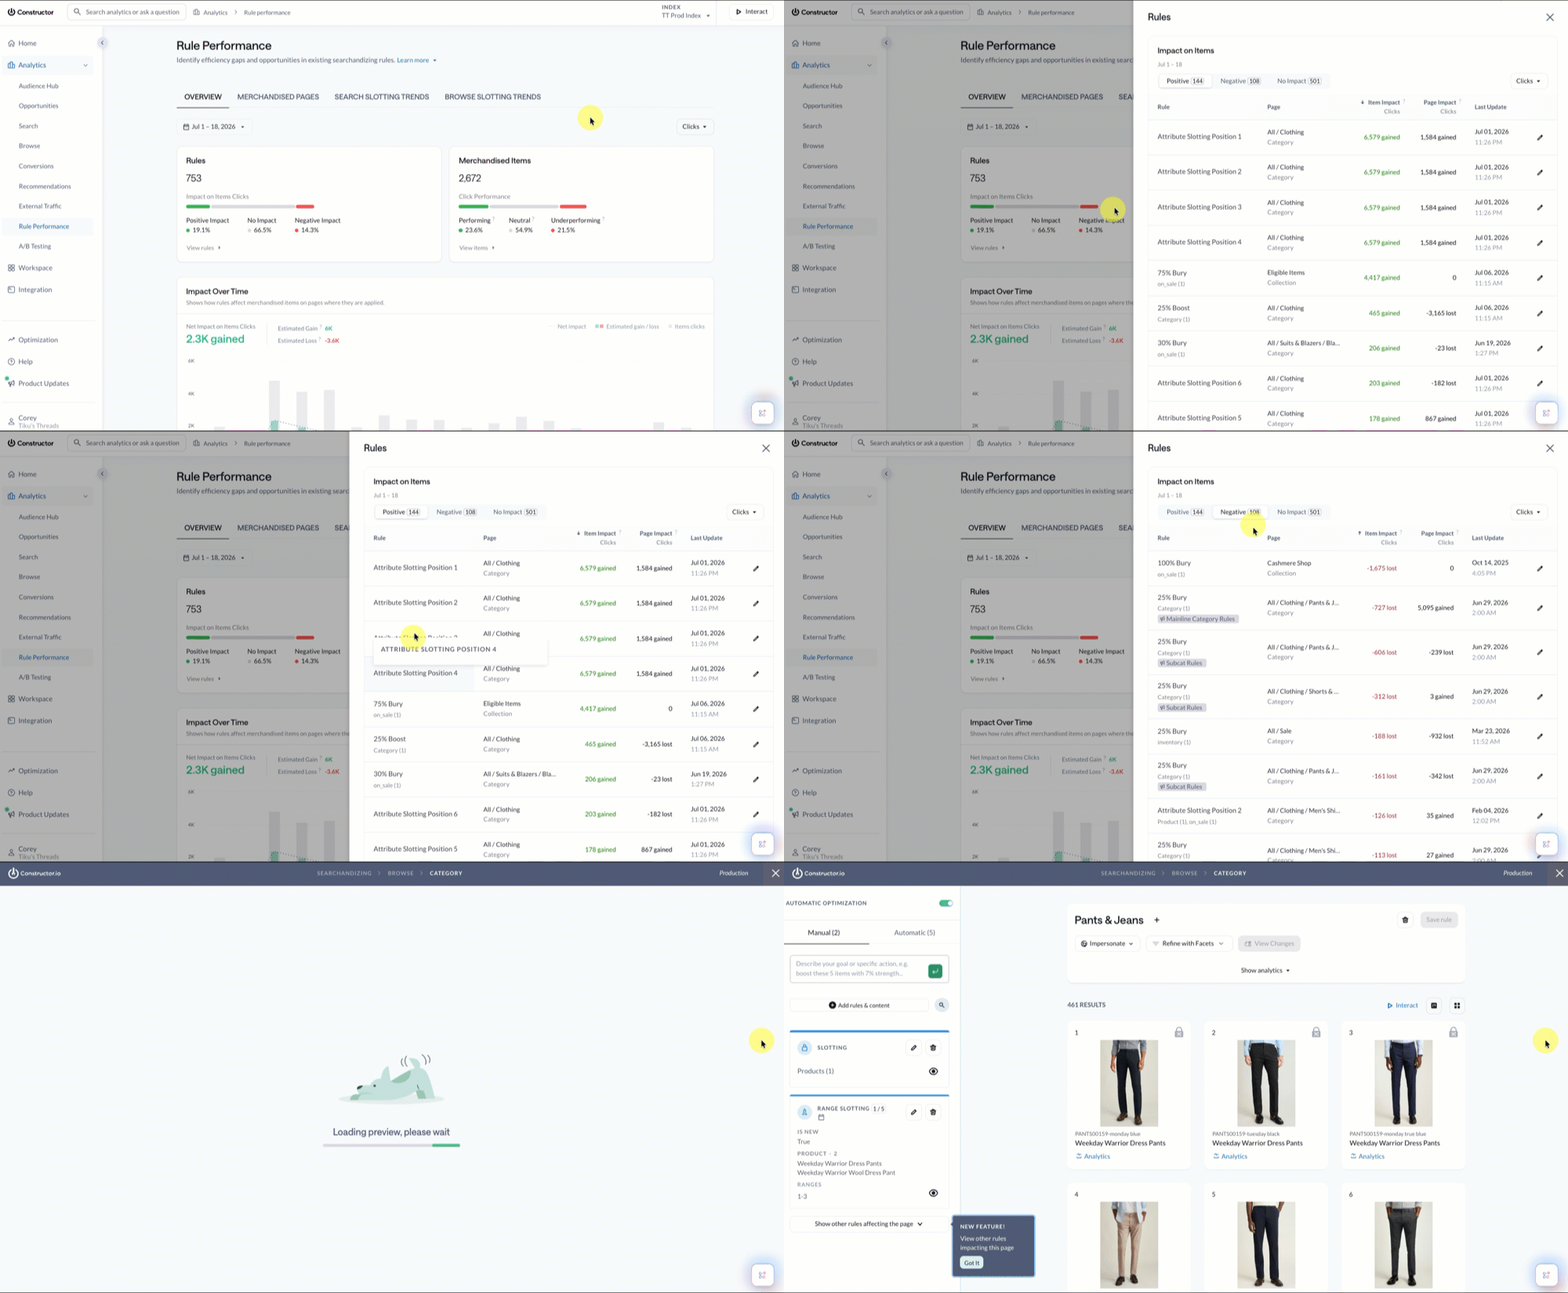
Use the bucket tabs (Positive, No Impact, Negative) at the top of the list to filter rules by impact.
For each rule, the list will show:
- Page: The specific search query results page, category page, collection, or facet page where the rule exists.
- Item impact: The change in merchandised item performance attributed to the rule over the selected date range.
- Page impact: The change in overall page performance attributed to the rule over the selected date range.
- Last update: Date when the rule was last edited.
Select the pencil icon on the far right of the rule row to edit the rule. The searchandising preview for the specific page (e.g., search query, category, collection, etc.) will open in a new tab.
Merchandised items summary
The Merchandised Items summary card shows the total number of items affected by merchandising rules, broken down by performance relative to the selected metric.
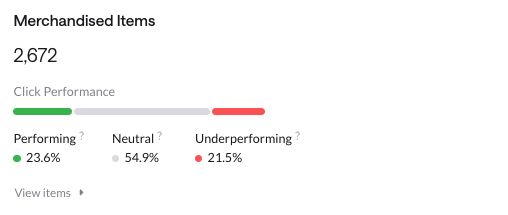
- Performing: Percentage of merchandised items associated with an estimated gain for the selected metric.
- Neutral: Percentage of merchandised items with no measurable estimated gain or loss for the selected metric.
- Underperforming: Percentage of merchandised items associated with an estimated loss for the selected metric.
View merchandised items
You can select View items in the bottom-left corner of the Merchandised Items summary card to launch a detailed list of items included in the summary.
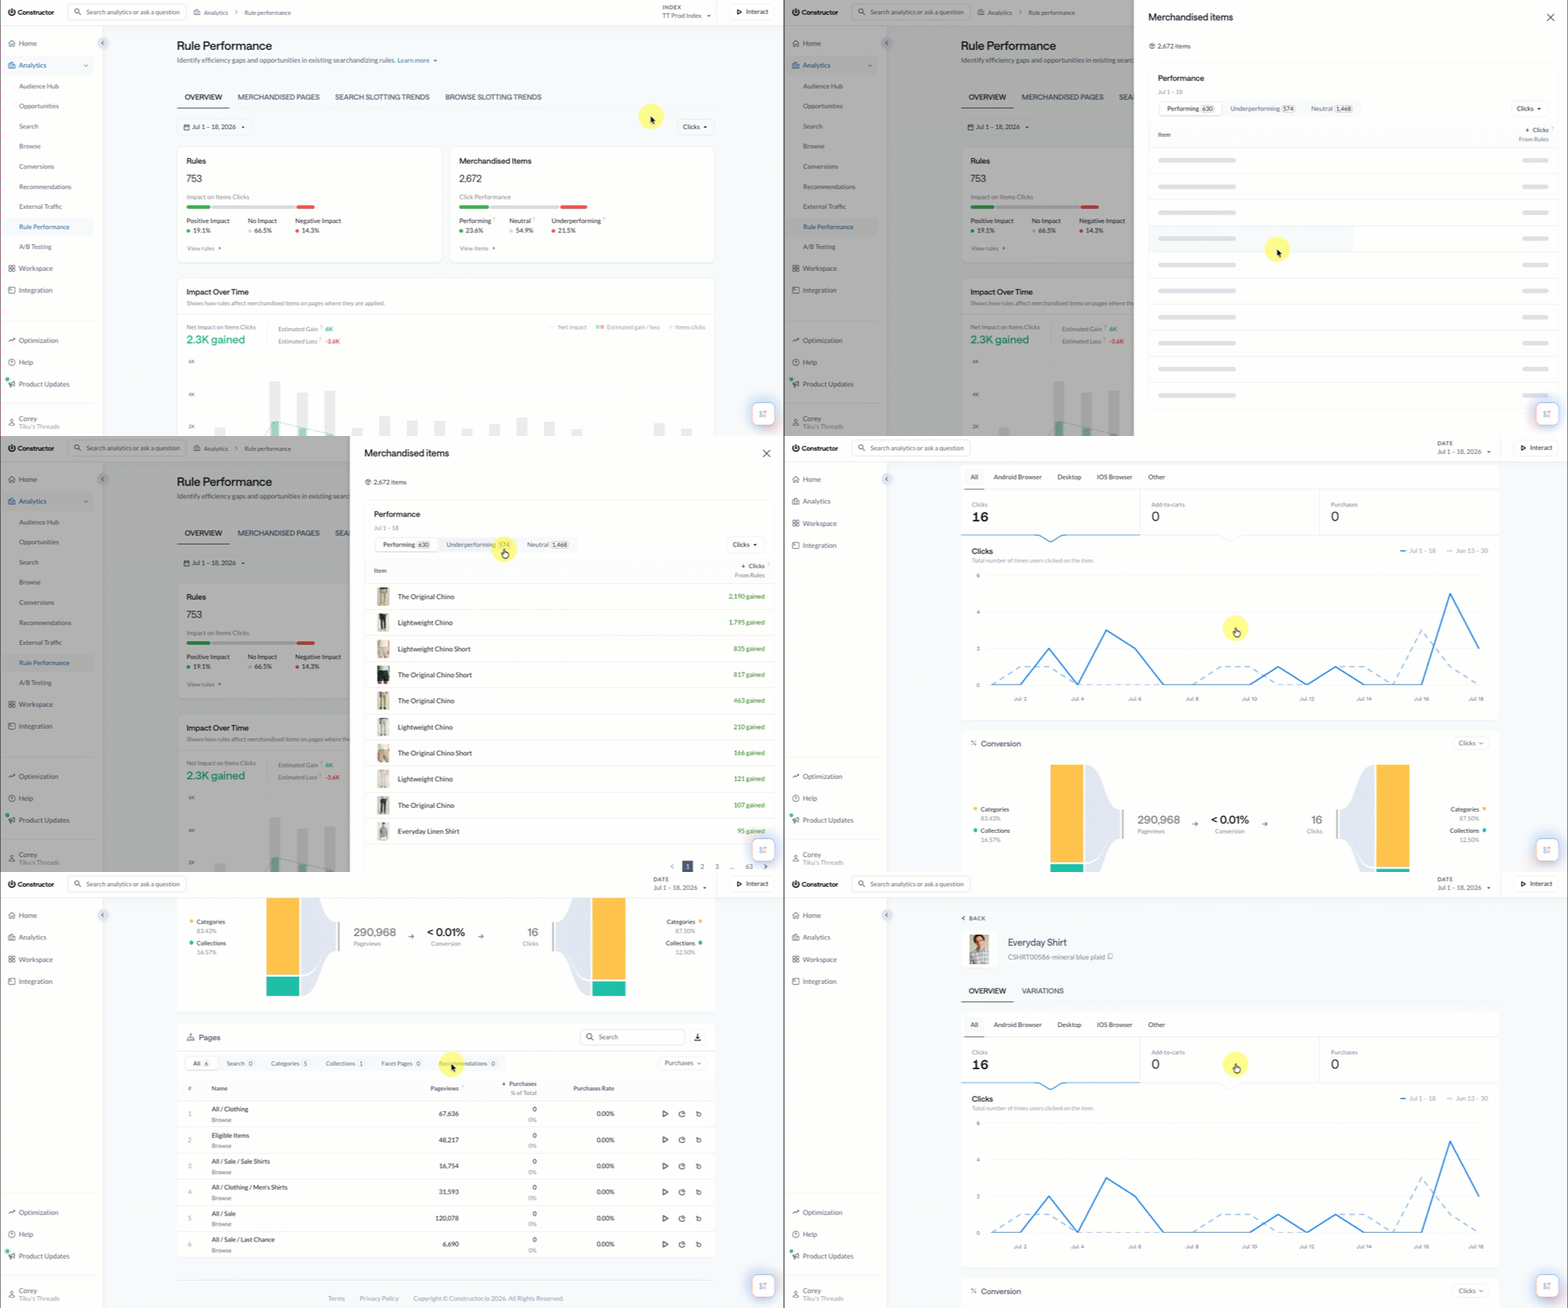
Use the bucket tabs (Performing, Underperforming, Neutral) at the top of the list to filter items by performance. For each item, the list will show each item's image, name, and metric gain or loss.
Selecting an item launches the Item Analytics page for that specific item. There you can view more detailed performance information for the item.
Impact over time
Impact Over Time shows how rules affect merchandised items on the pages (e.g., search, category, collection, etc.) where they are applied. This is shown as positive or negative gain, which is an estimate based on item performance seven (7) days before and after a rule change.
Hovering over the bar graph will show a breakdown for the day, including total purchases/clicks/add-to-carts, as well as the net impact (total estimated gain or loss).
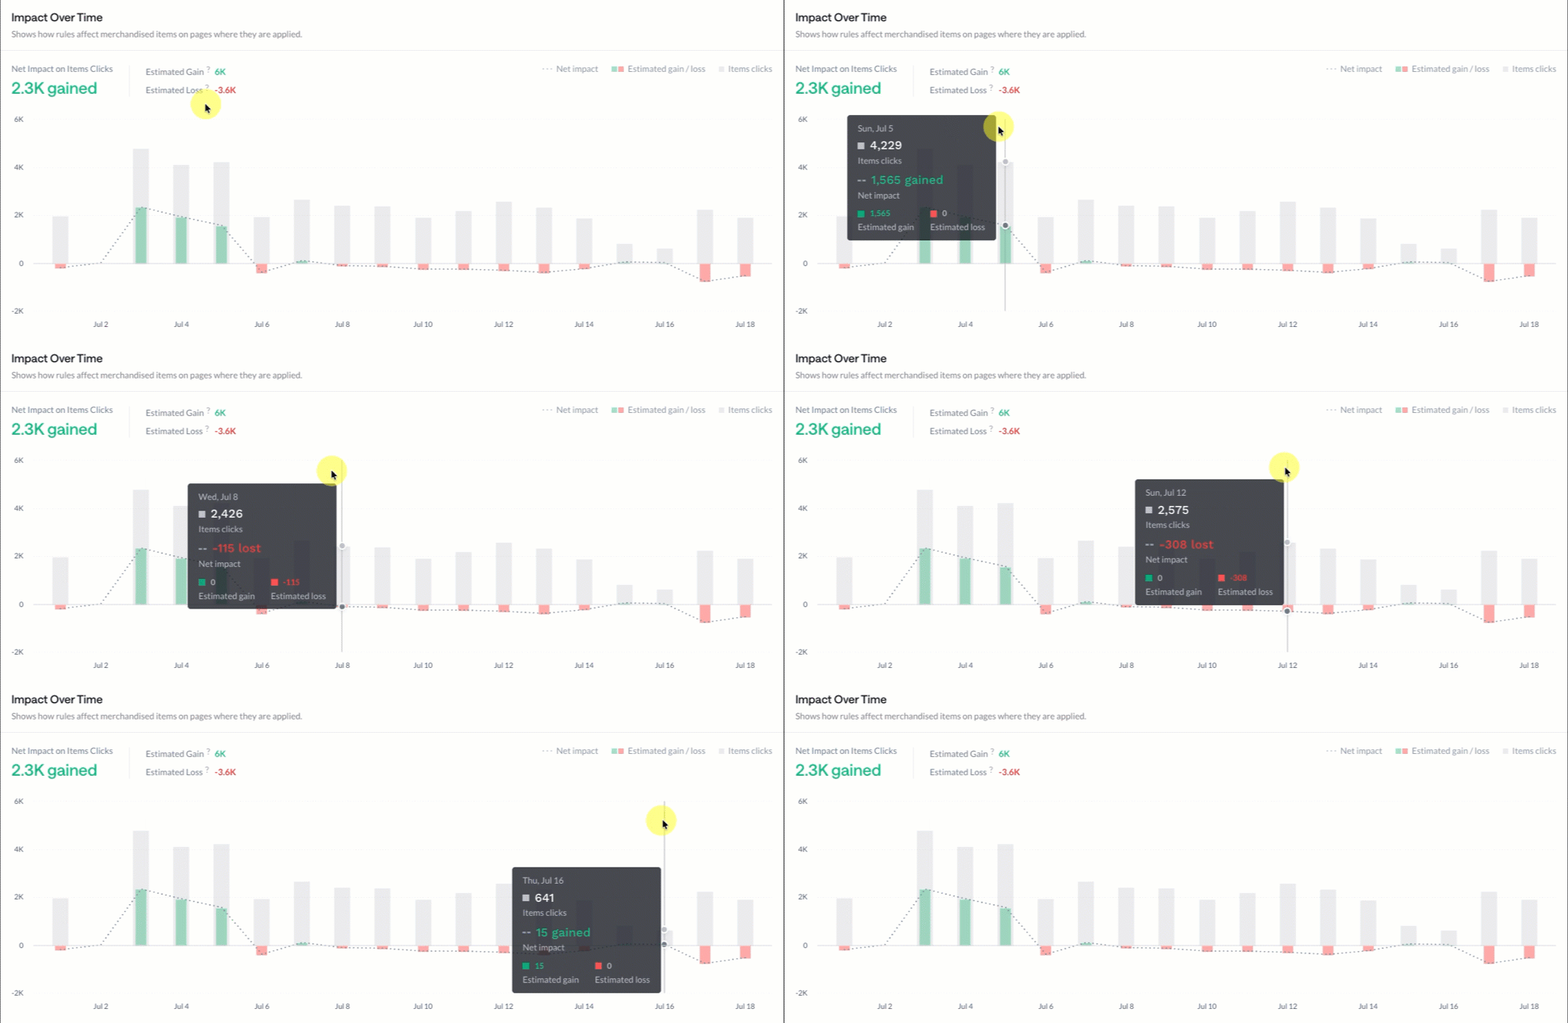
- Gray bar: Shows the actual observed value for the selected metric for a day (i.e., the total clicks, add-to-carts, or purchases for merchandised items).
- Green bar: Shows the estimated gain based on applied rules for the selected metric.
- Red bar: Shows the estimated loss based on applied rules for the selected metric.
Essentially, a green fill above the grey baseline indicates that active rules added value on that day. However, a red fill below the baseline indicates that active rules caused a net loss.
Please note: Estimated gain can exceed the actual metric value because it is based on item performance before and after a rule change, rather than on a direct measurement.
Impact return on cost
Impact Return on Cost summarizes the total estimated impact of rules on each metric (e.g., purchases, clicks, and add-to-carts).
Use the context tabs (Search, Category, Collection, Facet Page) at the top of the table to navigate between each context. Select a context to view more detailed data for the metric on the Merchandised Page Performance report.
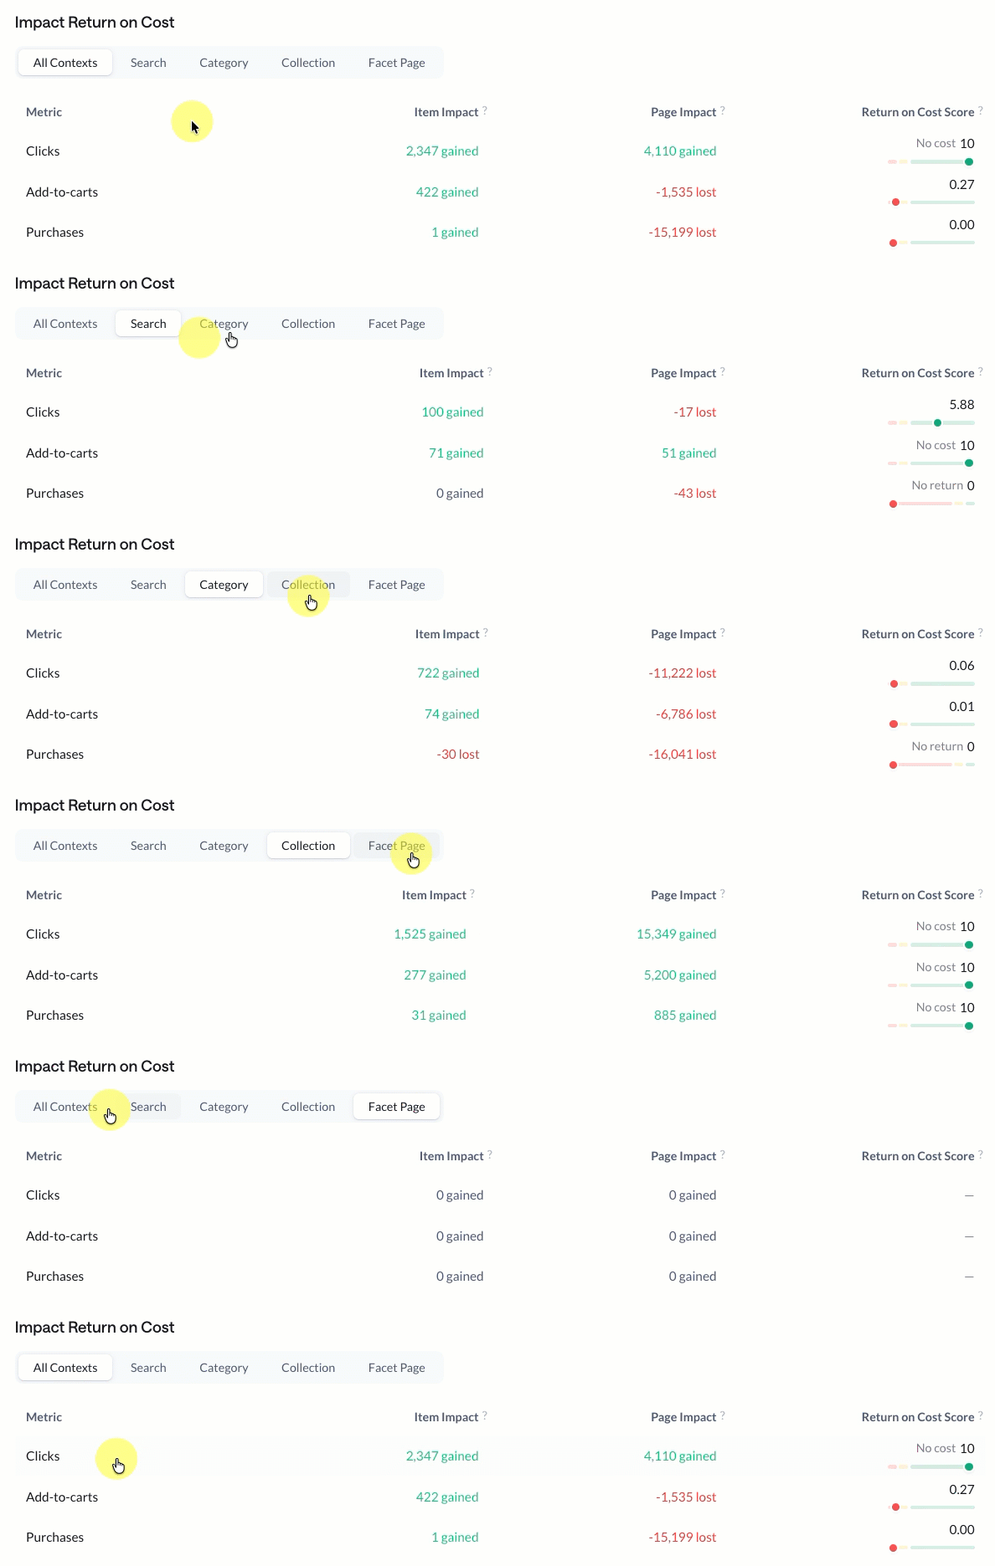
- Item Impact: Shows the estimated change in item performance for all items impacted by rules.
- Page Impact: Shows the estimated change in overall page performance for the specified metric.
- Return on Cost Score: Compares estimated gains on merchandised items to estimated losses across the overall page. Score range is 0 to 10.
- For example, if merchandised items gained an estimated 30 purchases, while the page lost an estimated 10 purchases, the score would be 3.
Updated about 2 hours ago