
External Traffic Report
The External Traffic Report shows retailers how traffic from outside their site contributes to product discovery and engagement on their site. Unlike traditional SEO tools that show only impressions and clicks, this External Traffic Report aims to connect the full journey in one dashboard.
For example, retailers can identify which external sources drive shoppers to their site, what shoppers do after they arrive, and how that traffic performs compared with other acquisition channels (e.g., search engines, direct links, and AI platforms).
Using this report, retailers can:
- Review trends by traffic source
- Identify sources that drive meaningful engagement
- Track changes in external traffic patterns over time
How Constructor identifies traffic sources
Constructor identifies traffic sources using the attribution signals available when a shopper lands on your site, including referrer information, URL parameters, and first-party behavioral tracking data. These signals help Constructor classify sessions into channels such as AI Platforms, Search Engines, Direct, Referral, Email, SMS, Paid Search, Paid Social, and Other. Learn more about channels.
Note that detailed query-level search data requires a Google Search Console integration. Please contact your Customer Success Manager for assistance.
Access the External Traffic Report
You can access the External Traffic report in two ways: via the Constructor dashboard homepage and through the Analytics side menu.
Via the Constructor dashboard
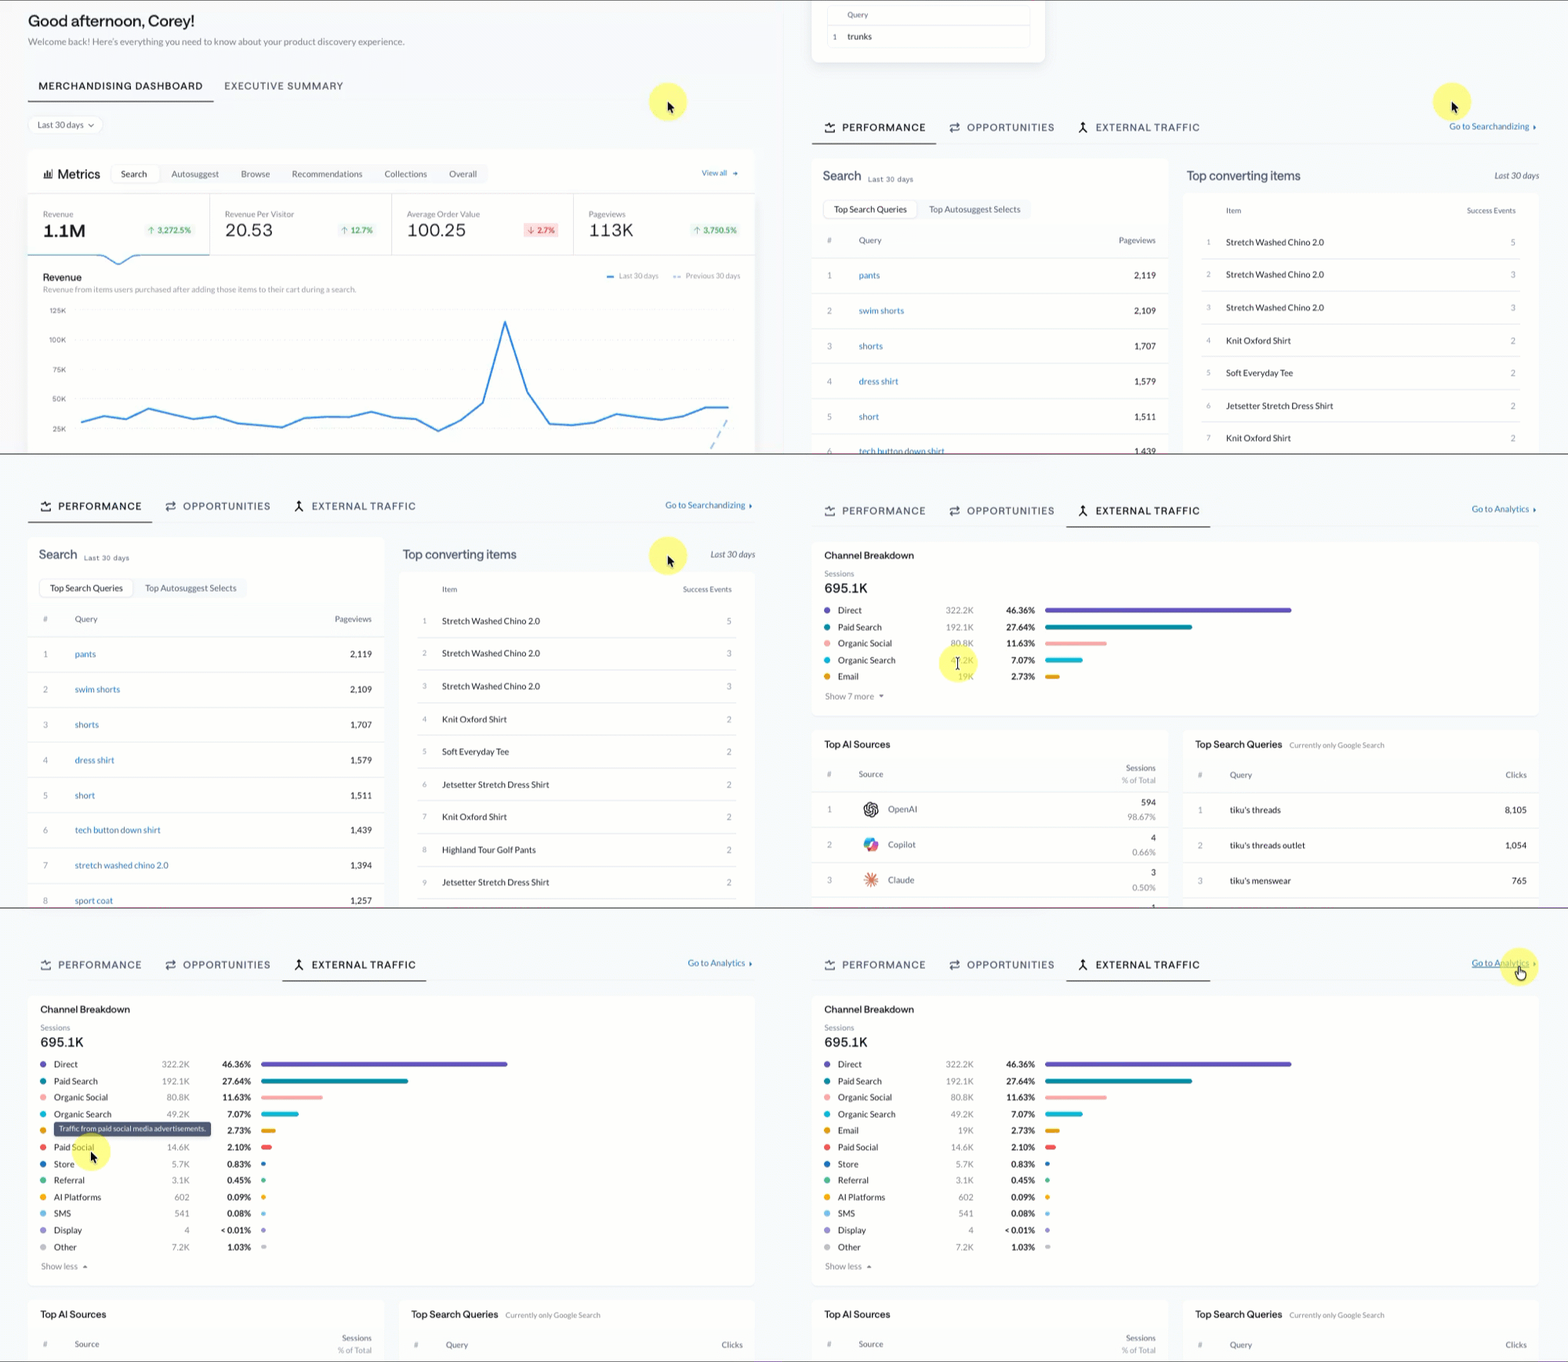
- On the Constructor dashboard homepage, scroll to and select the External Traffic tab at the bottom of the page.
- Here you can see a breakdown by channel as well as your top AI sources and top search queries for the last 7 days. Select Go to Analytics in the top-right corner of this section to jump to the full External Traffic Report.
Analytics menu
This path takes you to the full External Traffic report, which includes three tabs: Overview, AI Optimization, and Search Engines.
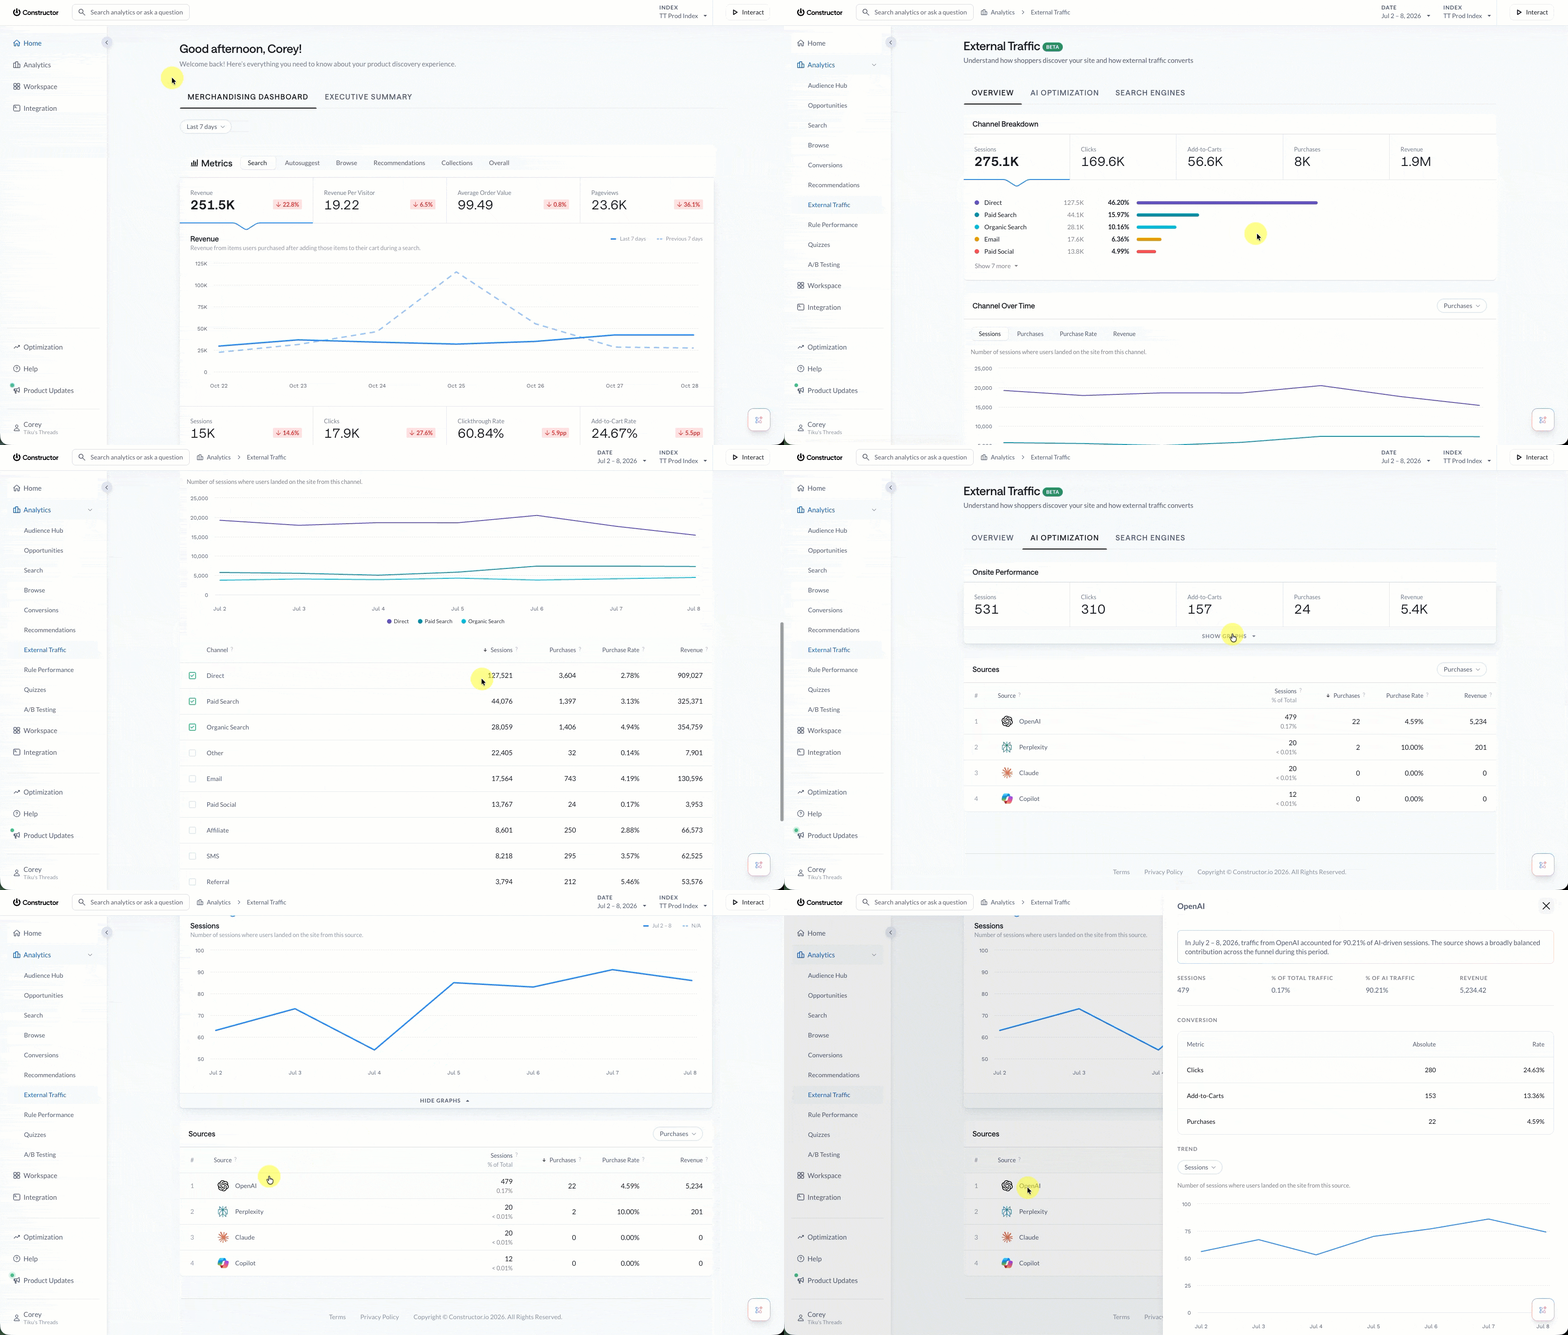
- Select Analytics in the side menu of the Constructor dashboard, then select External Traffic.
- Select the Date drop-down at the top of the page to view the report for a specific time period.
View analytics for multiple indexesData shown reflects the index(es) currently selected. Use the Index drop-down at the top of the page to select one or more indexes you wish to view. Selecting all indexes shows combined data for all indexes, whereas a single selected index shows data for that index.
Overview tab
The Overview tab in the External Traffic Report provides a high-level view of where shoppers come from before they reach your site and how they perform once they arrive.
It connects external traffic sources, such as Direct, Search Engines, AI Platforms, and other channels, with onsite metrics including sessions, clicks, add-to-carts, purchases, purchase rate, and revenue.
Channel breakdown
Use the Channel Breakdown section to compare the performance of each traffic channel side by side. This helps you understand which channels drive the most traffic, which channels convert most effectively, and which channels contribute most to revenue.
You can select a metric tab (e.g., sessions, clicks, etc.) to view a breakdown of that metric by sources. Select the Show more drop-down beneath the list of sources to view additional sources.
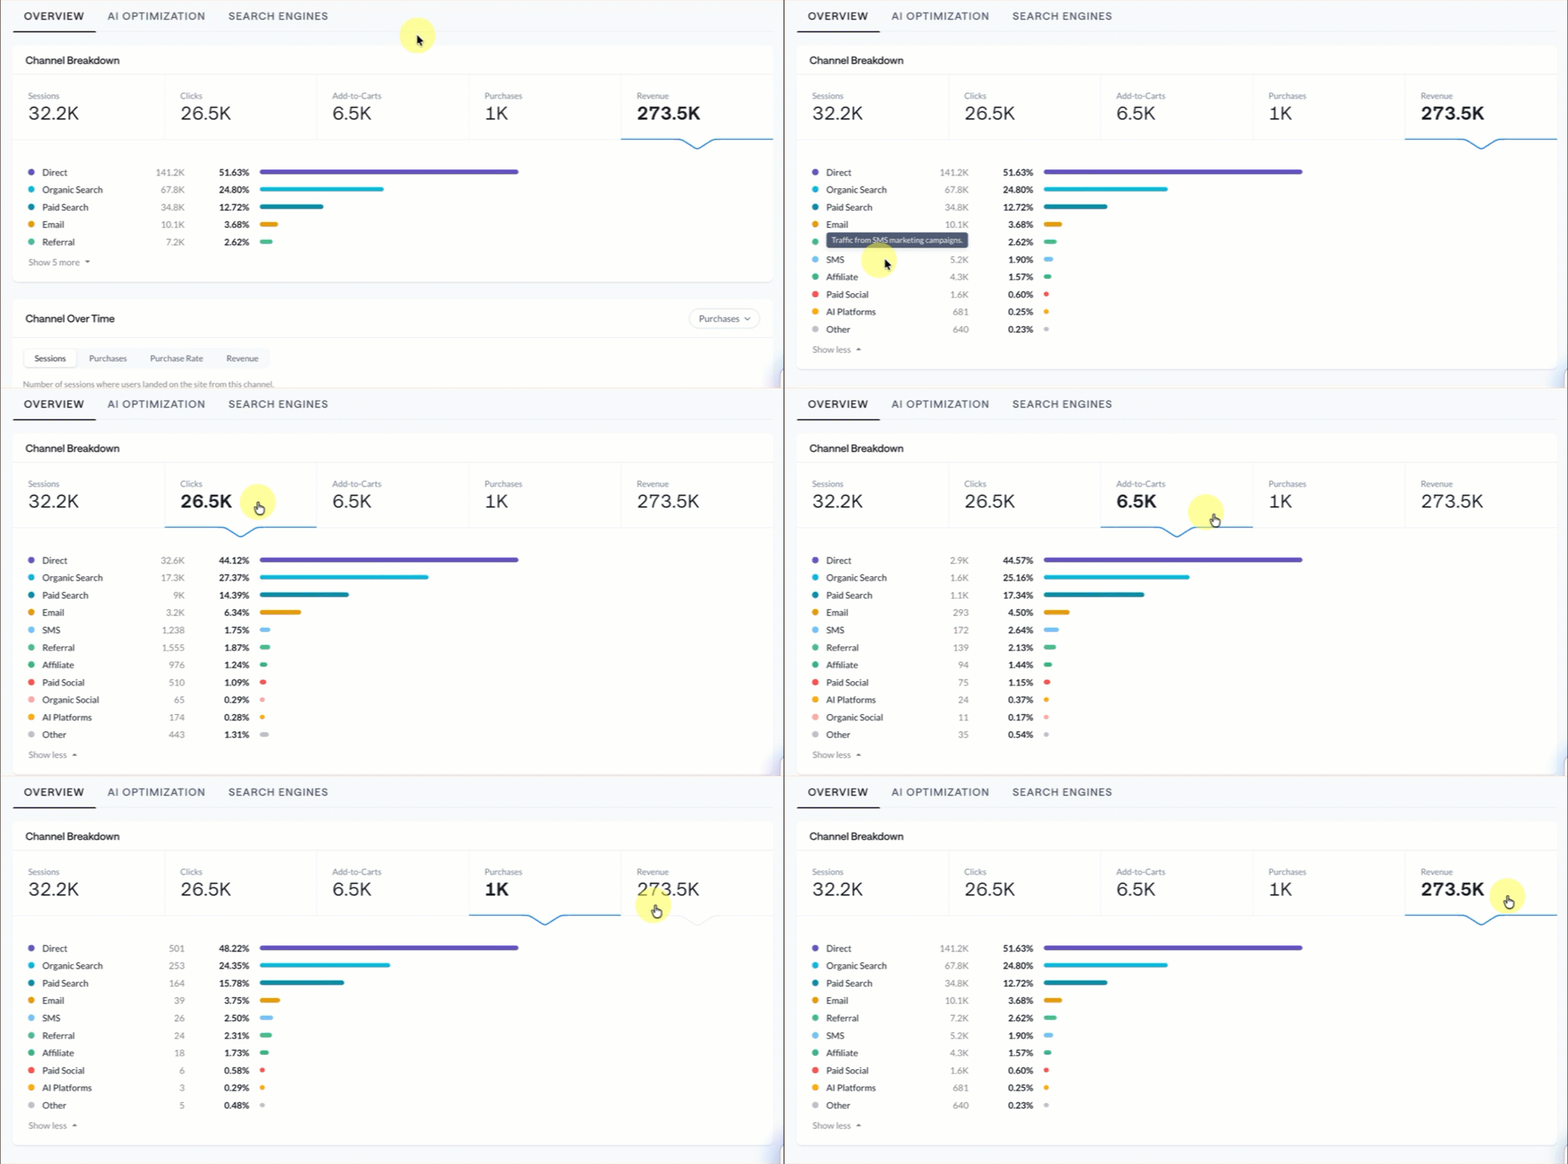
Note: Metrics reflect activity for the time period defined at the top of your Constructor dashboard.
Constructor classifies external traffic into four channels based on the referrer and behavioral signals:
| Channel | Sources | Description |
|---|---|---|
| Search Engines | Google, Bing, and other web search engines | Visitors who arrived via a search engine results page. If Google Search Console is connected, you'll also see query-level data. |
| AI Platforms | ChatGPT (OpenAI), Perplexity, Gemini, Claude, Copilot, and more | Visitors referred by AI assistants and generative engines. Detected via referrer headers and URL parameters matching. |
| Direct | Direct URL entry, bookmarks, untracked sources | Sessions where no external referrer was detected. Includes typed URLs, bookmarks, and some app-based traffic. |
| Other | Social media, email, referral, paid ads, etc. | All remaining external sources that don't fall into Search Engines, AI Platforms, or Direct. Constructor determines which sources to show based on the referring site and URL parameters (e.g., |
Note: If attribution signals are missing, incomplete, or don’t match a known category, traffic may be grouped into broader categories such as Direct, Referral, or Other.
Channel over time
Use the Channel Over Time section to view how external traffic patterns change over time. This can help you identify shifts in channel mix, monitor growth from emerging sources such as AI platforms, and assess whether changes in traffic are driving meaningful onsite engagement and revenue.
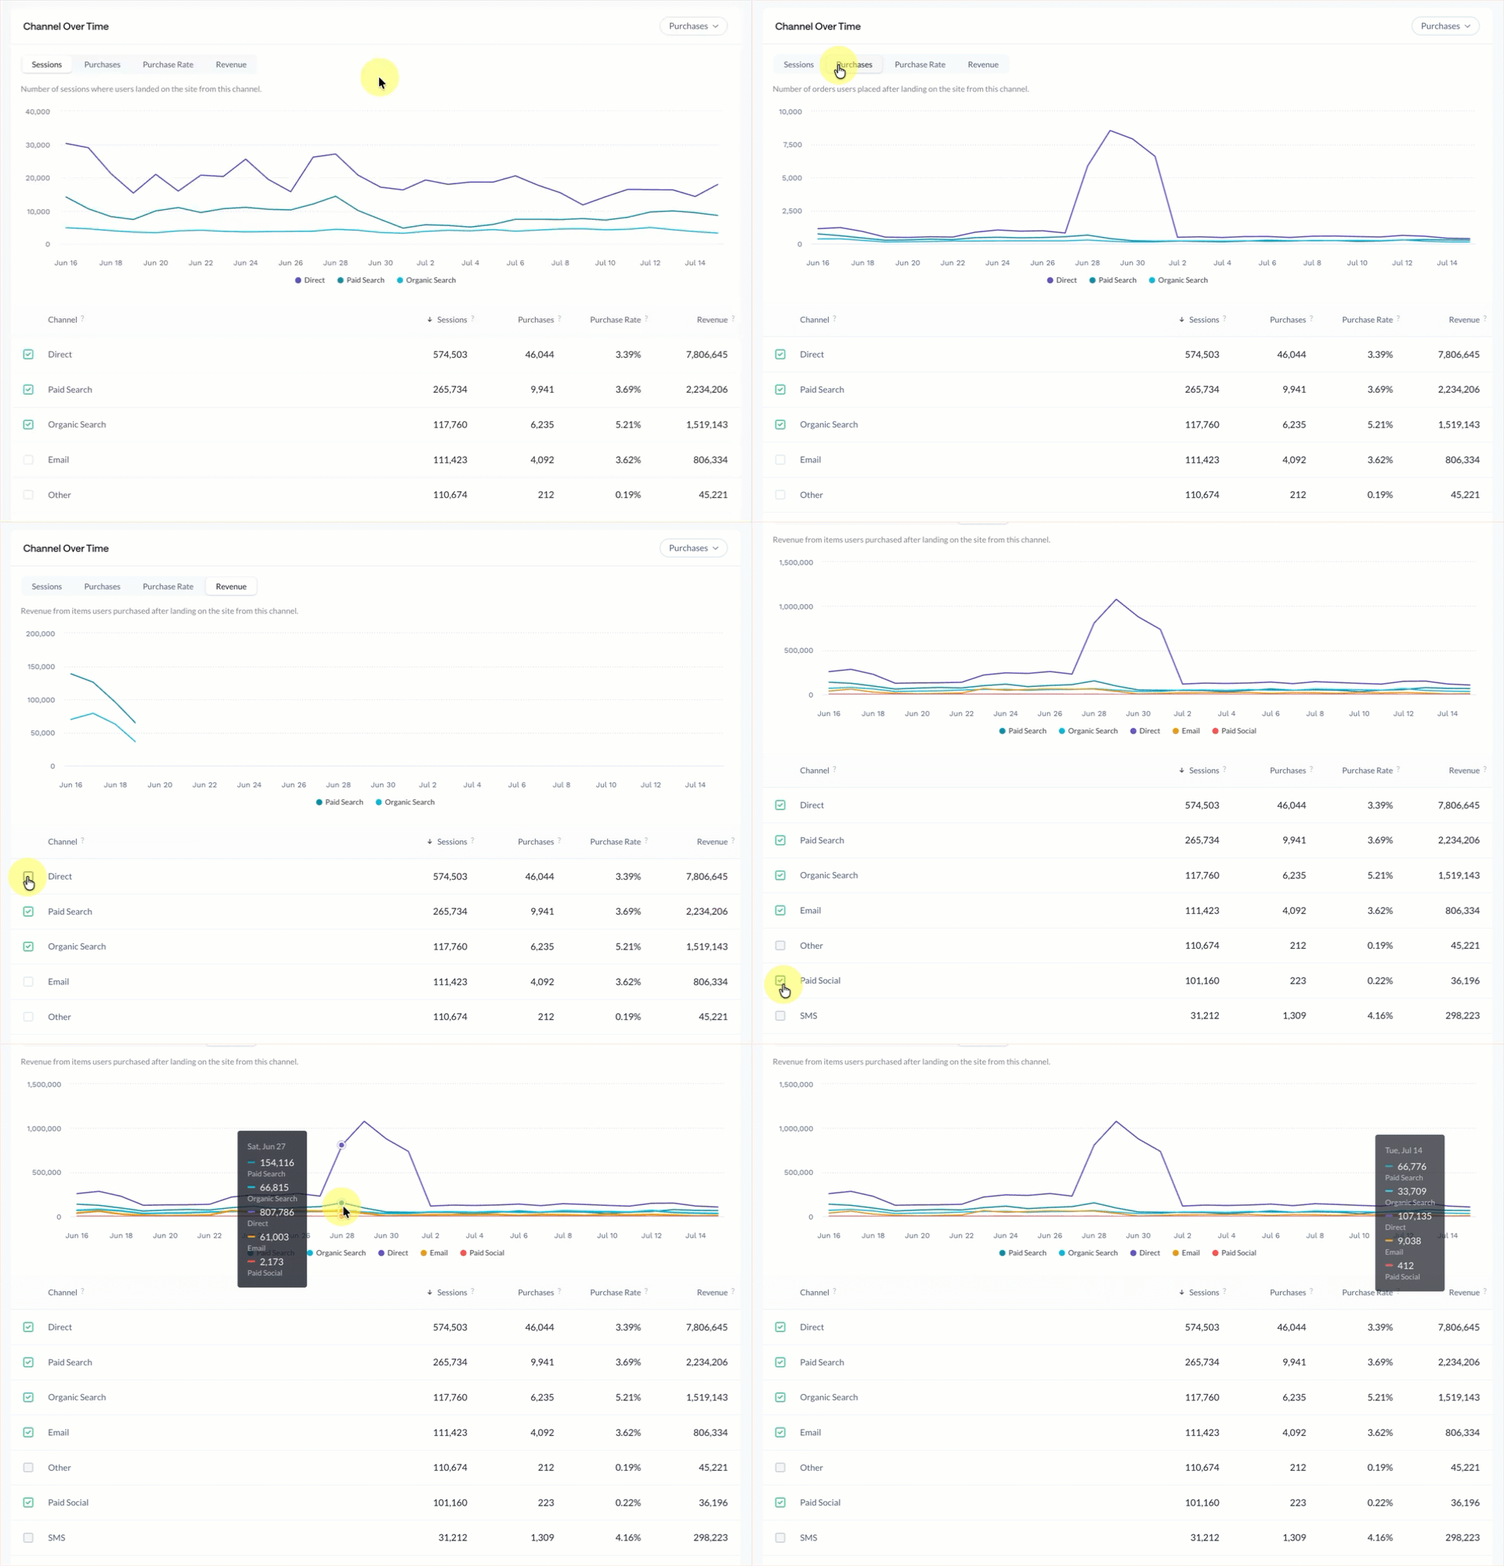
Note: Metrics reflect activity for the time period defined at the top of your Constructor dashboard.
- Select your desired metric (e.g., purchases, clicks, add-to-carts) using the drop-down in the top-right corner of the section.
- Once selected, use the tabs on the left side of the section to move between more refined metric options.
- In the Channel section, select the checkbox to the left of each channel name to view that channel in the line graph. Your top three (3) channels are selected by default
- Hover over the line graph to see a detailed breakdown of metrics by channel by day. This breakdown is also visible in the table.
AI Optimization tab
The AI Optimization tab shows how traffic from AI platforms performs after shoppers arrive on your site. It provides a focused view of AI-referred traffic, including overall onsite performance and a breakdown of individual AI sources.
It can help you move beyond the question of “Are AI platforms sending us traffic?” to questions like “Is that traffic engaging and converting?”
Onsite performance
Use the Onsite Performance section to view how shoppers from AI platforms engage and convert once they arrive on your site.
Select a metric tab (e.g., sessions, clicks, etc.) to move between available metrics. You can hover over the line graph to view metric totals by day (i.e., “5 clicks on July 4”).
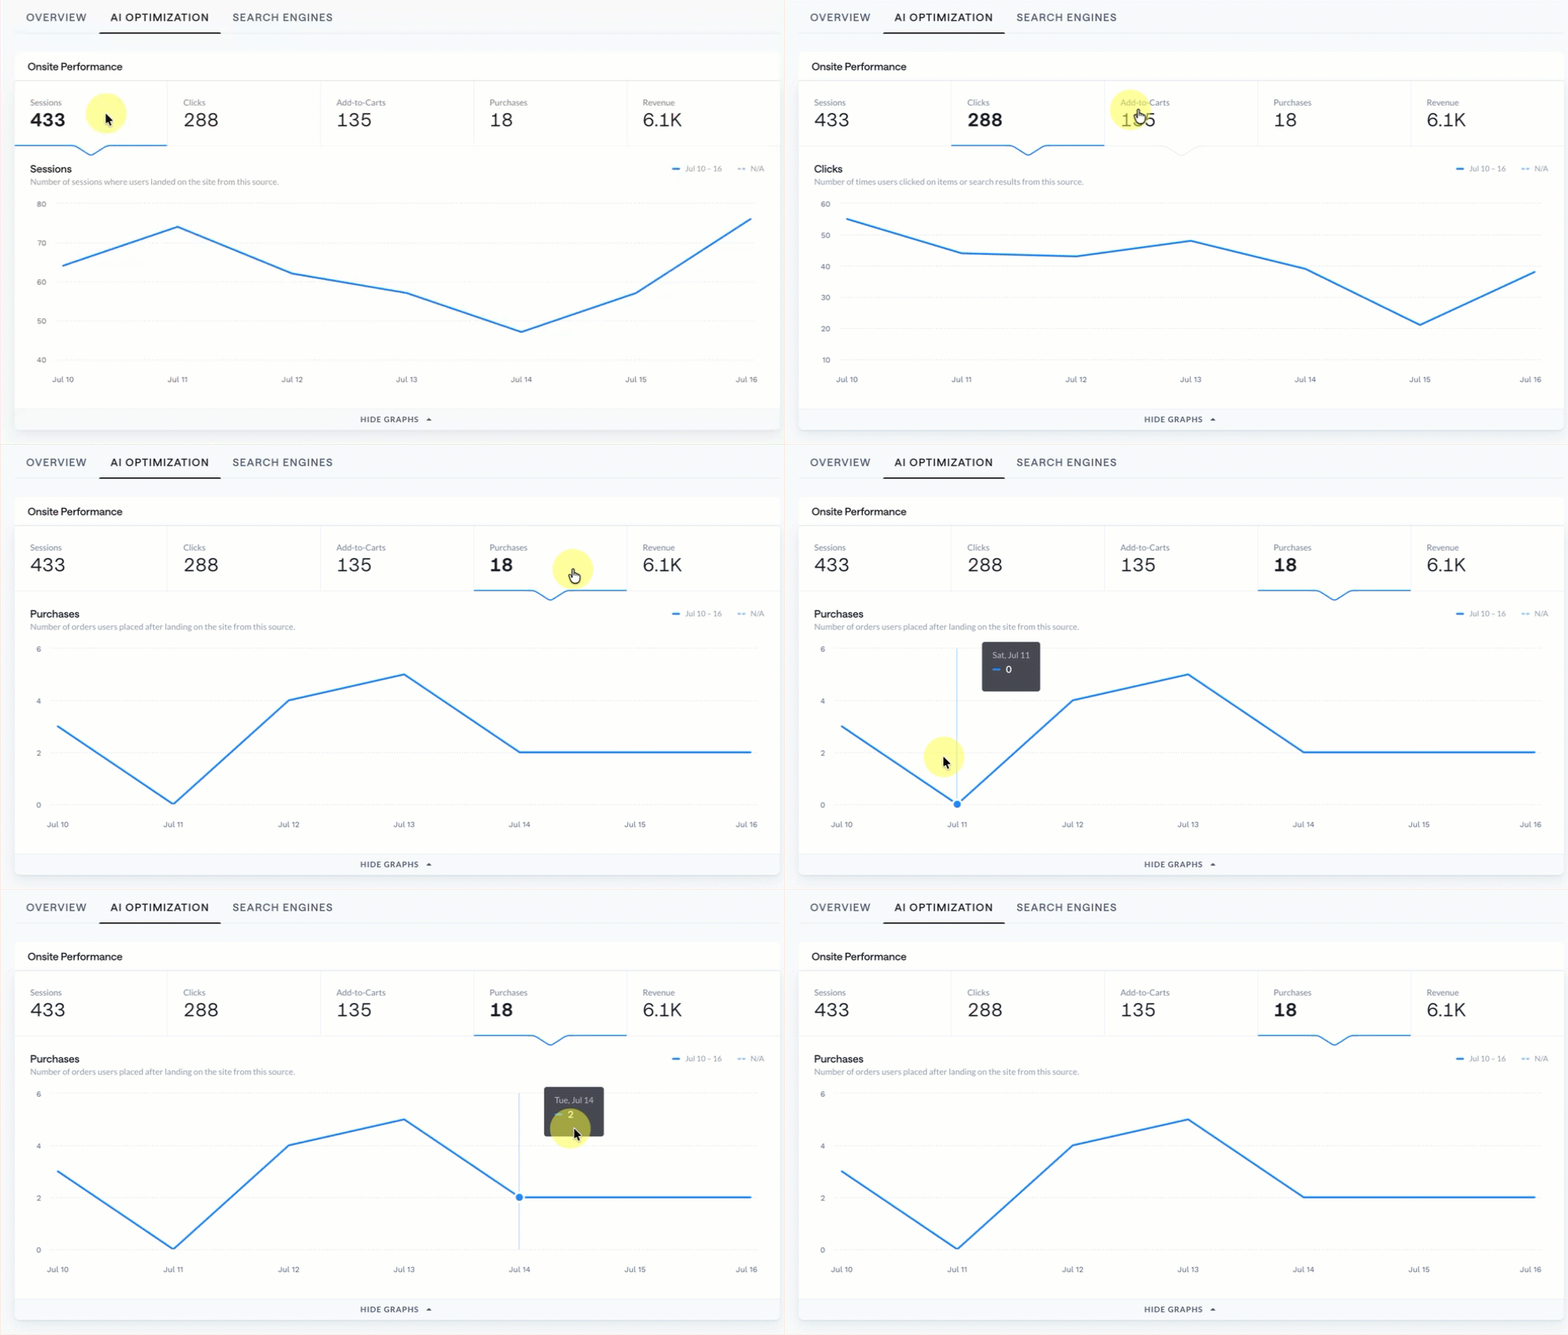
Note: Metrics reflect activity for the time period defined at the top of your Constructor dashboard.
- Sessions: Number of shoppers who visited your site from AI platforms.
- Clicks: Number of times shoppers from AI platforms engaged with products or results on your site.
- Add-to-Carts: Number of times shoppers from AI platforms added items to their cart.
- Purchases: Number of orders completed by shoppers who came from AI platforms.
- Revenue: Total revenue generated by shoppers who came from AI platforms.
Sources
Use the Sources section to see which AI platforms are sending traffic and how each source performs. This helps you compare traffic share, purchase share, purchase rate, and revenue across individual AI sources.
Select the drop-down in the top-right corner of the table to switch between metrics (e.g., clicks, add-to-carts, and purchases).
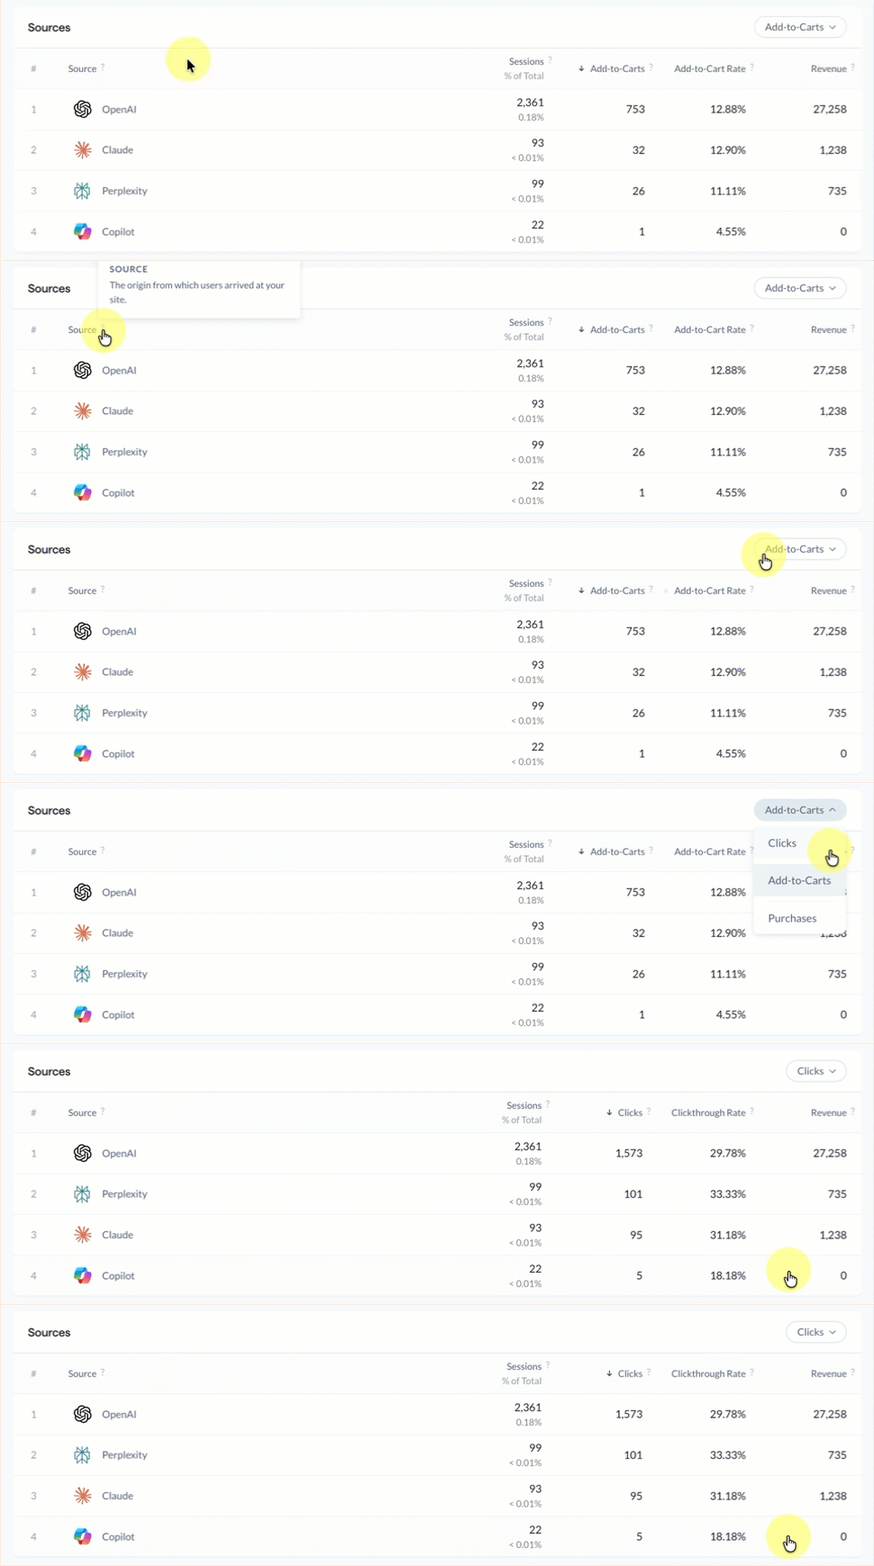
Note: Metrics reflect activity for the time period defined at the top of your Constructor dashboard.
- Sessions: Number of sessions originating from the specified AI platform.
- % of Total (Sessions): The percentage of overall AI platform traffic attributed to the specified AI platform.
- Add-to-Carts: Number of times shoppers originating from the specified AI platform added an item to their cart.
- Add-to-Cart Rate: The percentage of overall add-to-carts originating from AI platforms attributed to the specified AI platform.
- Clicks: Number of product interactions (e.g., clicks on items, search results, etc.) made by shoppers originating from the specified AI platform.
- Clickthrough Rate: The percentage of overall clicks originated from AI platforms attributed to the specified AI platform.
- Purchases: Number of purchases made from shoppers originating from the specified AI platform.
- Purchase Rate: The percentage of overall purchases originate from AI platforms attributed to the specified AI platform.
- Revenue: Revenue attributed to the specified AI platform.
Search Engines tab
The Search Engines tab shows how search engine traffic performs after shoppers arrive on your site. It provides a focused view of search-driven visits, including overall onsite performance and query-level search information. At this time, search engine traffic is based on data from Google Search Console.
Connecting Google Search ConsoleTo populate the Search Engines tab, generate Google Search Console API credentials and share them with your Customer Success Manager. Constructor will complete the setup, validate the connection, and begin surfacing Search Engines data in the External Traffic Report.
Onsite performance
Use the Onsite Performance section to understand how shoppers from search engines engage and convert, including sessions, clicks, add-to-carts, purchases, purchase rate, and revenue.
Select a metric tab (e.g., sessions, clicks, etc.) to move between available metrics. You can hover over the line graph to view metric totals by day (i.e., “5 clicks on July 4”).
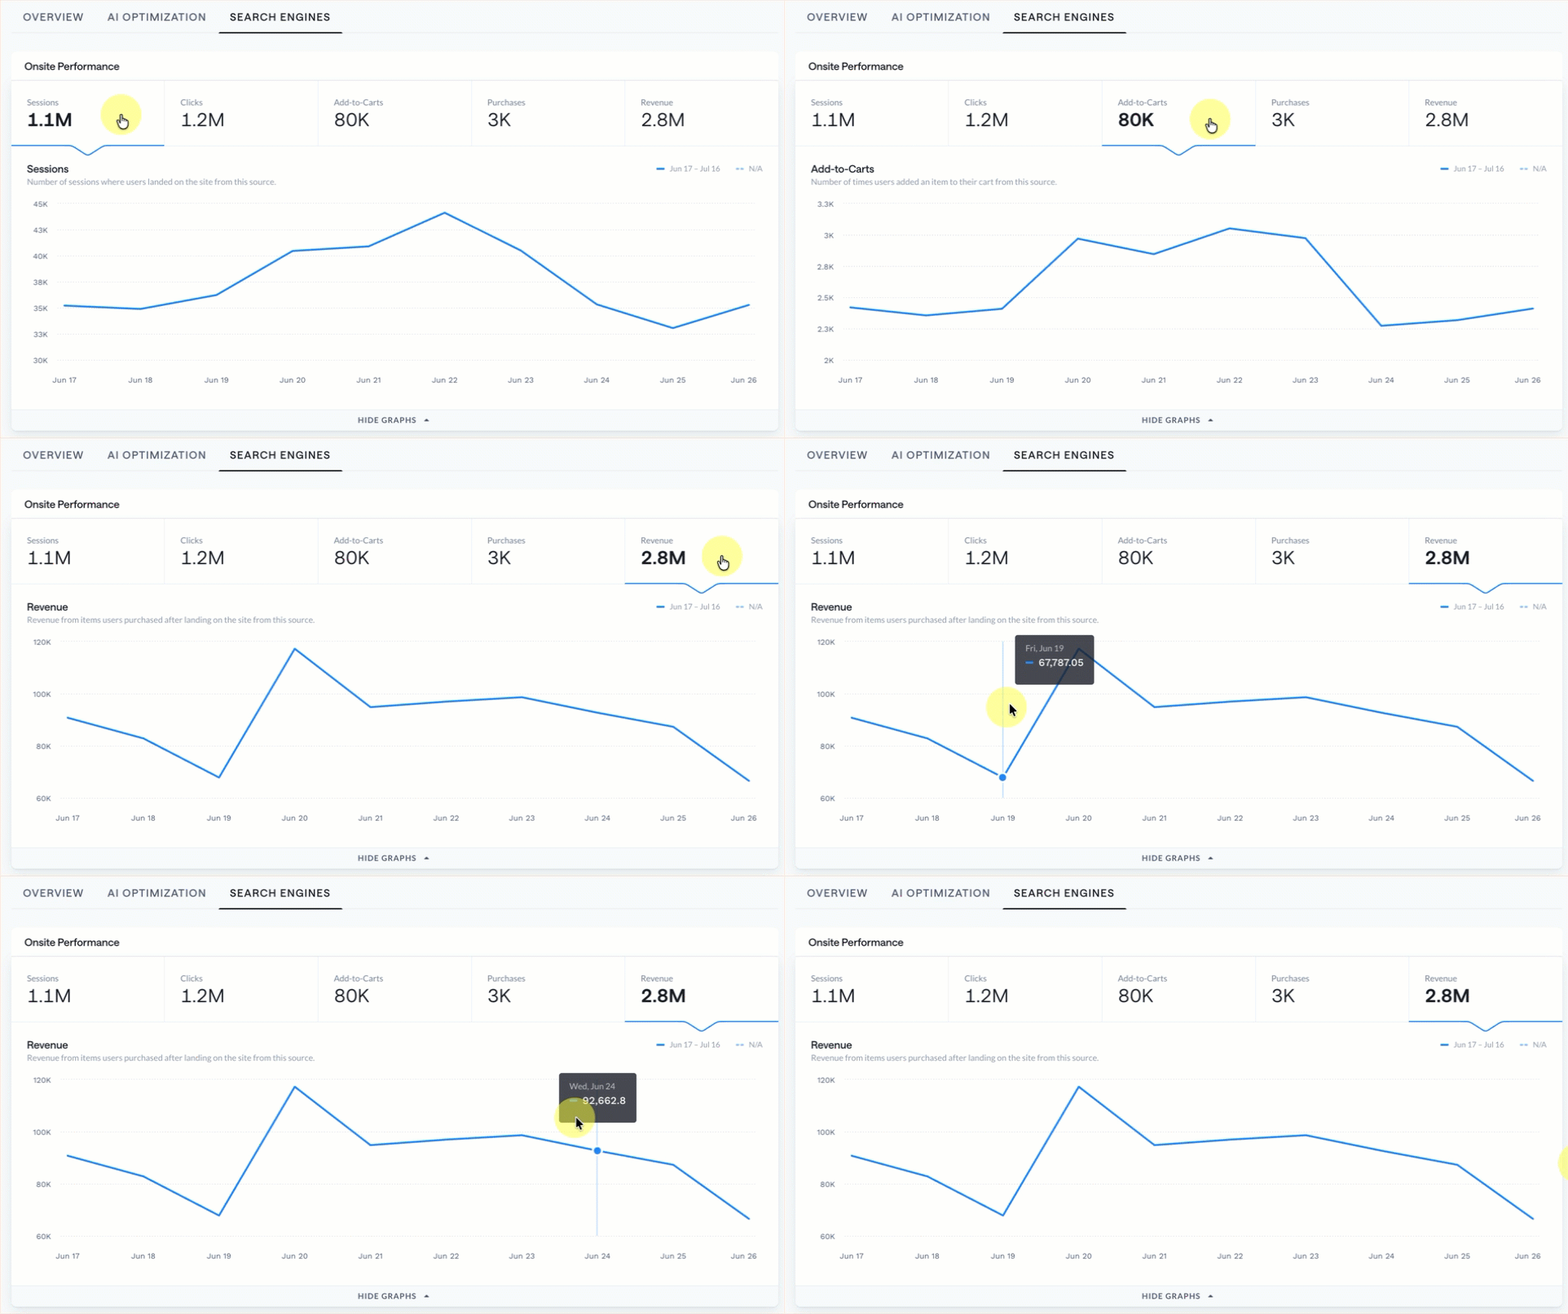
Note: Metrics reflect activity for the time period defined at the top of your Constructor dashboard.
Queries
Use the Queries section to see which search terms are bringing shoppers to your site. This helps you understand which queries are driving visibility and traffic, and how search-driven visitors behave after they land on your site.
Use the Search field in the top-right corner of the section to search for a specific query. Results filter as you type. Turn the Hide branded queries toggle on to hide all search queries containing your company name/brand.
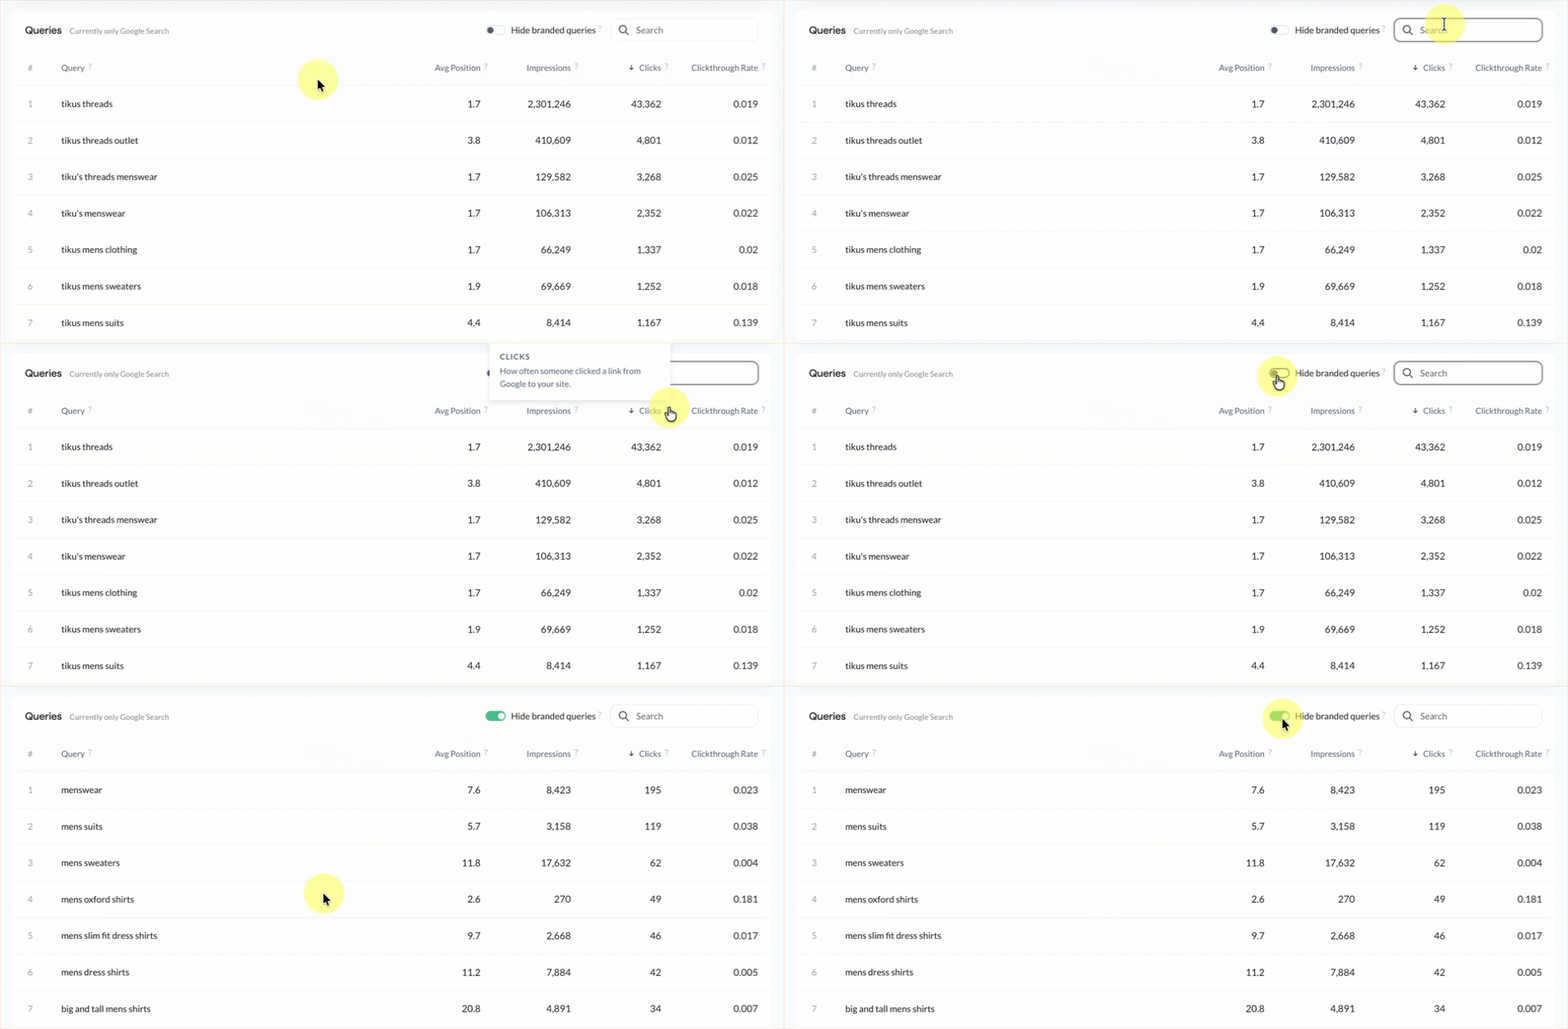
Note: Metrics reflect activity for a specific query for the time period defined at the top of your Constructor dashboard.
- Query: The search term shoppers used before visiting your site.
- Avg. Position: The average ranking position of your site for that query.
- Impressions: How often your site appeared in search results for that query.
- Clicks: How often shoppers clicked through to your site from that query.
- Clickthrough Rate: The percentage of impressions that resulted in a click.
Updated 20 days ago