Merchandised Page Performance report
Constructor’s Merchandised Page Performance report is designed to give merchandisers visibility into how the manual slotting, boost, and bury rules they created are potentially impacting item and page performance on specific search, browse category, collection, and facet pages.
Why is this important?
While companies often use slotting, boosting, and/or burying rules to promote various products, styles, and brands, they may not wish to do so at the expense of overall revenue.
This report allows merchandisers to quickly see pages where searchandising rules are potentially negatively impacting page and merchandised item performance. Merchandisers can view performance as three different metrics: purchases, add-to-cart actions, and clicks.
How can I use this report?
Merchandisers can use this report as a before-and-after analysis of page and merchandised item performance, meaning performance before newly created or updated rules and after newly created or updated rules.
By default, the report is sorted by the Page + Metric column (not page name), from highest loss to highest gain. This way merchandisers can see pages where rules may have hurt overall performance the most.
⚠️ Please note: This report represents only a correlation between rules and performance, not causation. Other factors, such as changes in traffic, seasonality, and promotions, can also impact item performance. The Constructor team is actively working on improvements to the Merchandised Page Performance report and aim to roll out additional use cases soon.
How does the comparison window work?
As mentioned earlier, the Merchandised Page Performance report presents a before-and-after snapshot of item performance.
Specifically, this report calculates a 7-day comparison window before and after the date when a merchandiser last created or updated a rule on the specified page. This means that after seven (7) days pass, Constructor stops calculating metrics. As a result, merchandisers are viewing a before and after snapshot.
Here’s an example:
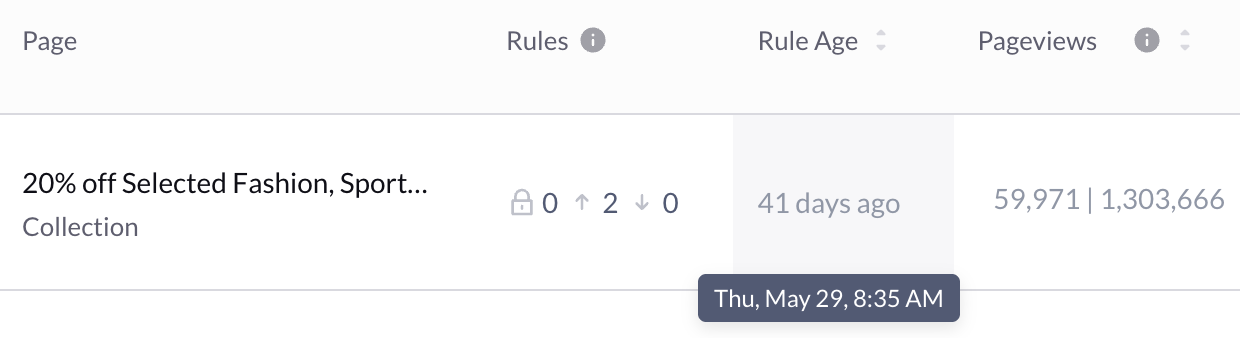
A merchandiser added two boost rules to this collection page on May 29. In the Pageviews column, we see the left metric, 59,971, which represents total pageviews seven days before May 29 (May 22 - May 28). The right metric, 1,303,666, represents total pageviews seven days after May 29 (May 30 - June 5). The day of creation or update is not included in either the before or after calculation.
These metrics remain fixed whether the merchandiser looks at the report a week, month, or year after this window concludes.
Why a 7-day comparison window?If rules were going to significantly impact a page, it would likely occur shortly after merchandisers made changes to the rules. Therefore, Constructor uses a 7-day comparison window to focus on the potential impact of the last rule change.
Significant changes that happen two weeks after an update would likely not be related to changes in rules but rather other factors, such as traffic, seasonality, or promotions.
How soon will changes to the rules on a page appear?
Merchandisers can expect to see updates to a page (i.e., changes based on a new rule, edited rule, or deleted rule) within 1-2 days. Similarly, pages with new rules that were without rules previously will appear within 1-2 days. This is the amount of time Constructor needs to calculate data.
⚠️ Please note: Changes to rules will restart the comparison window for a page. In the initial days of the change, the before and after figures will represent the numbers that have passed. For example, if it had been 2 days since the page was updated, then the metrics will reflect two days before and two days after the update. Once the number of days reaches seven, the calculation will stop.
Navigate to the Merchandised Page Performance report
- Select Analytics in the side menu of the Constructor dashboard, then select Rule Performance.
- Select the Merchandised Pages tab at the top of the page. This is the default view.
View performance for various merchandised pages
The Merchandised Page Performance report displays all pages that have at least one (1) searchandising rule applied.
Merchandisers can view rules by specific page types (e.g., Search, Category, Collection, etc.) or all rules for all page types by selecting the page type name at the top of the table.
Additionally, merchandisers can search for a specific page by entering the page name in the provided search field. Note that you must be on the All tab or the tab for the page type that corresponds to the page you are searching for it to appear.
Merchandised page performance table
By default, the Merchandised Page Performance report is sorted by the Page + Metric column (not page name), from highest loss to highest gain.
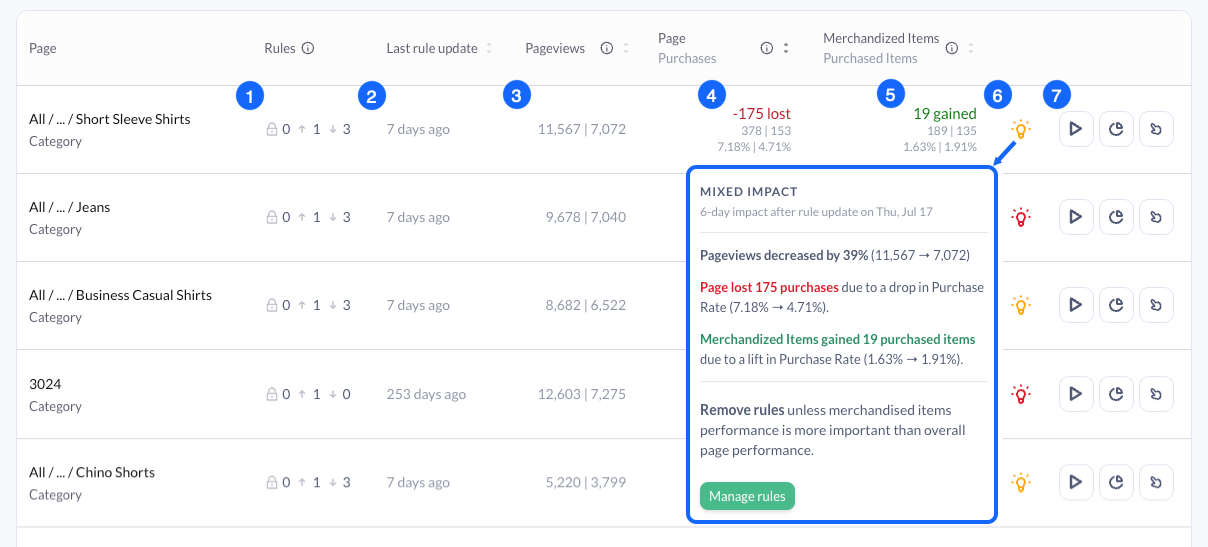
- Rules: Displays the number of rules currently live on the page. The order of rules is slotting, boost, and bury. Last rule update: Displays when merchandisers last updated one or more rules on the page. Hover over the number of days to see the exact date of the last rule update.
- Pageviews: Displays the number of pageviews within (or up to) the 7-day period before and after the date when merchandisers last updated rules on a page.
- Page + Metric: Merchandisers can choose to view overall page-level metrics for Purchases, Add-to-Carts, or Clicks by selecting the desired metric from the drop-down above the top-right corner of the table. The order of displayed metrics are:
- Normalised change in purchases/add-to-carts/clicks.
- Total number of purchases/add-to-carts/clicks before and after a rule change.
- The purchase rate/add-to-cart rate/clickthrough rate before and after a rule change.
- Learn more here.
- Merchandised Items + Metric: Merchandisers can choose to view Purchases, Add-to-Carts, or Clicks metrics specific to all items impacted by rules (i.e., 1 slotted position and 1 boost rule for the attribute
color = redcould impact a total of 17 items on a page). Select the desired metric from the drop-down above the top-right corner of the table. The order of displayed metrics are:- Normalised change in purchases/add-to-carts/clicks.
- Total number of purchases/add-to-carts/clicks for merchandised items before and after a rule change.
- The purchase rate/add-to-cart rate/clickthrough rate or merchandised items before and after a rule change.
- Learn more here.
- Insights: Proposes a suggested action based on page performance. Hover over the light bulb icon to view the suggestion.
- Action buttons: Offers merchandisers the option to navigate to the page in Interact (play icon), navigate to detailed analytics for the page (graph icon), or navigate to the searchandising rules for the page (pointing icon).
A note about rule-level detailAt this time, the Merchandised Page Performance report does not show rule-level detail. For example, while merchandisers made changes to rules on a page (such as adding, editing, or deleting), this report does not specify those changes.
Merchandised page metrics
The Page + Metric column displays metrics for the entire page calculated for up to 7 days before and after rule changes.
Constructor normalises lost/gained values to reflect an increase or decrease in purchases due to a change in purchase rate. This is calculated as Pageviews after * (Purchase rate after - Purchase rate before).
Take this example: 3,541 * (0.98% - 1.51%)= -19. Even though the merchandiser sees an increase in pageviews post rule change (1,430 -> 3,541), the purchase rate decreased, which suggests a potential negative impact from the rule(s).
Merchandisers can choose which metric to view (Purchases, Add-to-Carts, or Clicks) by selecting the metric from the drop-down above the top-right corner of the table.
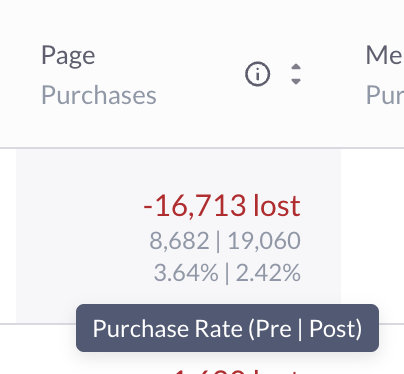
- The top row appears either in red or in green, depending on whether a page potentially generated fewer or more purchases/add-to-carts/clicks after the last rule update.
- The second row displays absolute numbers of purchases/add-to-carts/clicks during (or up to) 7 days before and after the last rule update.
- The third row displays the rate for purchases/add-to-carts/clicks during (or up to) 7 days before and after the last rule update.
It’s important to note that changes in traffic due to marketing promotions, seasonality, or trends can also significantly impact page performance. While this report reflects performance around the time of the last rule change, merchandisers should keep any data related to additional factors on hand when deciding on the impact of rules.
Merchandised item metrics
The Merchandised Items + Metric column in the table displays metrics for only items affected by the rules on the page for up to 7 days before and after rule changes.
Merchandisers can choose which metric to view (Purchases, Add-to-Carts, or Clicks) by selecting the metric from the drop-down above the top-right corner of the table.
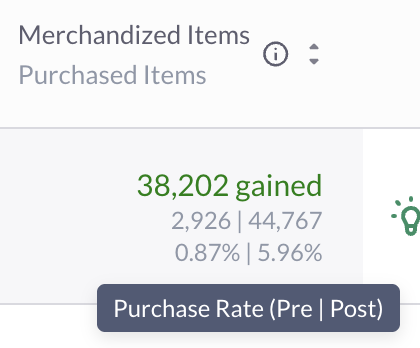
- The top row appears either in red or in green, depending on whether a page potentially generated fewer or more purchases/add-to-carts/clicks for merchandised items after the last rule update.
- The second row displays absolute numbers of purchases/add-to-carts/clicks or merchandised items during (or up to) 7 days before and after the last rule update.
- The third row displays the rate for purchases/add-to-carts/clicks for merchandised items during (or up to) 7 days before and after the last rule update.
As mentioned earlier, it’s important to note that changes in traffic due to marketing promotions, seasonality, or trends can also significantly impact merchandised item performance. While this report reflects performance around the time of the last rule change, merchandisers should keep any data related to additional factors on hand when deciding on the impact of rules.
A note on merchandised itemsAt this time, the Merchandised Page Performance report does not specify the total number of items impacted by page rules.