View campaign analytics
You can easily view the performance of your Retail Media campaigns, both overall and by a specific campaign. Analyzing these metrics allows you to identify underperforming campaigns, optimize strategies, and make data-driven decisions to maximize campaign success.
Currently, the following performance metrics are available:
- Impressions
- Clicks
- Add to carts
- Purchases
- Spend
- Attributed revenue
- Return on ad spend (ROAS)
We discuss each metric in more depth below.
Choose key metric and time period
When viewing campaign analytics, you do so by key metric, such as impressions, ROAS, or clicks. You can change this key metric at any time to view different campaign performance data.
- Select the Analytics tab at the top of the Retail Media dashboard.
- Choose the metric you wish to view from the drop-down above the top-left corner of the graph.
- Apply a date range to the analytics shown using the Dates field above the top-right corner of the graph.
- Once selected, it will launch a calendar view that will allow you to define your desired date range. Select Apply once done.
Display and review metrics on the graph
The graph will display any selected campaigns and/or sponsored items within the date range you defined. These campaigns and items are also listed in the table at the bottom of the page.
- Show campaign performance in the graph: select the eye icon to the left of the campaign name in the table. Campaigns with a slash through the eye will not appear on the graph.
- Show sponsored item performance in the graph: In the table, expand the specific campaign the item is a part of, then select the eye icon to the left of the item name.
Each campaign and/or item you select will appear on the graph with a unique color. This color also appears in the table, highlighting the field for the key metric you selected at the top of the page (e.g., Impressions, ROAS, Clicks, etc.). This allows you to easily identify a campaign or item in the graph.
- Filter table to display selected campaigns and/or items: Turn on the Selected element toggle in the top-left corner of the table.
- View a breakdown of the key metric across the defined date range: Hover over the graph lines to see a day-by-day summary of the key metric.
View metrics in the table
The table displays data for key metrics, such as impressions, clicks, and return on ad spend (ROAS).
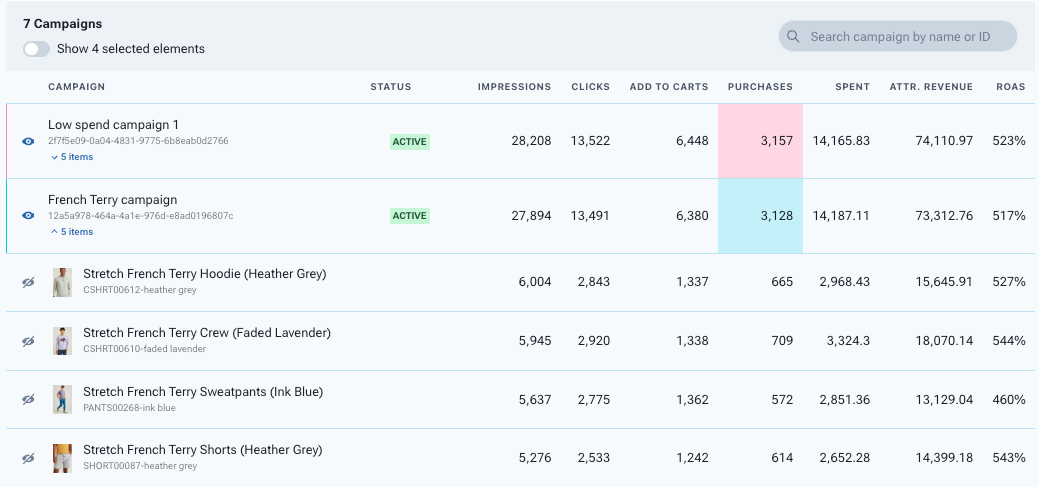
- Search for a campaign: Use the search field in the top-right corner of the table to locate a campaign. You can search by campaign name or ID.
- View performance of campaign items Select the item count beneath the campaign name and ID. This expands the campaign and allows you to see metrics broken down by item. These metrics reflect an item’s performance for the specific campaign.
- Filter table to display selected campaigns and/or items: Turn on the Selected element toggle in the top-left corner of the table.
Metrics
Add to carts
Add to carts refers to the number of times users added a campaign’s sponsored item to their cart during the campaign’s active window. You can view item-specific add to cart counts by expanding the campaign in the table, while the overall add to cart count is summarized at the campaign level.
Ad spend
Ad spend is the amount of money spent to promote campaign items. Ad spend is calculated by multiplying the number of clicks on sponsored items shown by the clearing bid price at time of click (# of clicks * bid price).
Attributed revenue
Attributed revenue is the money earned from sales that can be directly linked to a sponsored listing. For example, if a user clicks a sponsored item and later purchases any item from that brand, the sales revenue is attributed to the promotion.
The retailer sets the window for attributed revenue. Generally, this window aligns with the average time users need to make a purchase decision. If you have questions about the attribution window, please contact your retailer.
Clicks
Clicks refers to the number of times a user interacts with a returned sponsored item. Clicks are a key metric for measuring the effectiveness of a sponsored item in encouraging users to take action, such as making a purchase. A high volume of clicks generally indicates greater interest from the audience.
Impressions
Impressions refers to the number of times sponsored items were shown to users, regardless of whether the users clicked the item.
Each time a sponsored item is shown on a search query or browse results page, it counts as one impression. If three of an advertiser’s items appear on a page, this would count as three impressions. This can help you measure how often your sponsored items are being seen, which is important for understanding the reach and visibility of a campaign.
Purchases
Purchases refers to the number of times users purchased any item from a specific advertiser after interacting with a sponsored item from the advertiser’s active campaigns. However, item-specific purchases, as seen when the campaign is expanded, reflect the specific purchase count for that item during the campaign’s active window. For this reason, the sum of item-level purchases might not equal campaign-level purchases.
Return on ad spend (ROAS)
Return on ad spend (ROAS) refers to the revenue you earn for every dollar spent on advertising. ROAS can help you assess the effectiveness and profitability of your efforts.
ROAS is a ratio of attributed revenue to ad spend, indicating the return generated for each dollar spent on advertising.
Spent
Spent refers to the total amount spent to sponsor a specific item or items in a campaign. You can view item-specific spend by expanding the campaign in the table, while overall item spend is summarized at the campaign level.
Download campaign-specific analytics
You can download analytics for a specific campaign from the Campaigns tab.
- Select Campaigns at the top of the Retail Media dashboard.
- Locate the campaign for which you wish to download analytics.
- Select the three-dot icon to the right of the campaign name.
- Select Download analytics from the options provided.
- On the pop-up, choose your:
- Format: Options include CSV or .xlsx.
- Dimension: Options include by items or pages.
- If you wish to have data split by days, then select the corresponding checkbox.
- Select Download.
The file will download to your device. You can then upload the file to your desired platform or spreadsheet solution.
In the file, you will find a breakdown of metrics by sponsored item. These metrics include:
- Impressions
- Clicks
- Click rate (% of clicks on every impression)
- Add to carts
- Add to cart rate
- Number of purchases
- Attributed revenue
- Browse pages where the product was shown the most
- Search keywords where the product was shown the most
- Average CPC
- Spend
- Return on ad spent (ROAS)
- Advertising cost of sales (ACOS)