Continuous optimization
At Constructor, we take a different approach to delivering value: we don’t believe in one-size-fits-all algorithms. Instead, our team of dedicated data scientists works directly with each of our customers to craft algorithmic variants tailored to their business goals, shopper behavior, and industry characteristics.
Previously, our data scientist worked behind the scenes, identifying new algorithmic variants and testing their impact on a customer’s key business outcomes. Findings were then communicated to customers through conversations with our Customer Success team. Now, we're making these improvements visible: you can track the results of these custom tests directly in your dashboard, bringing full transparency to the performance gains Constructor’s delivering.
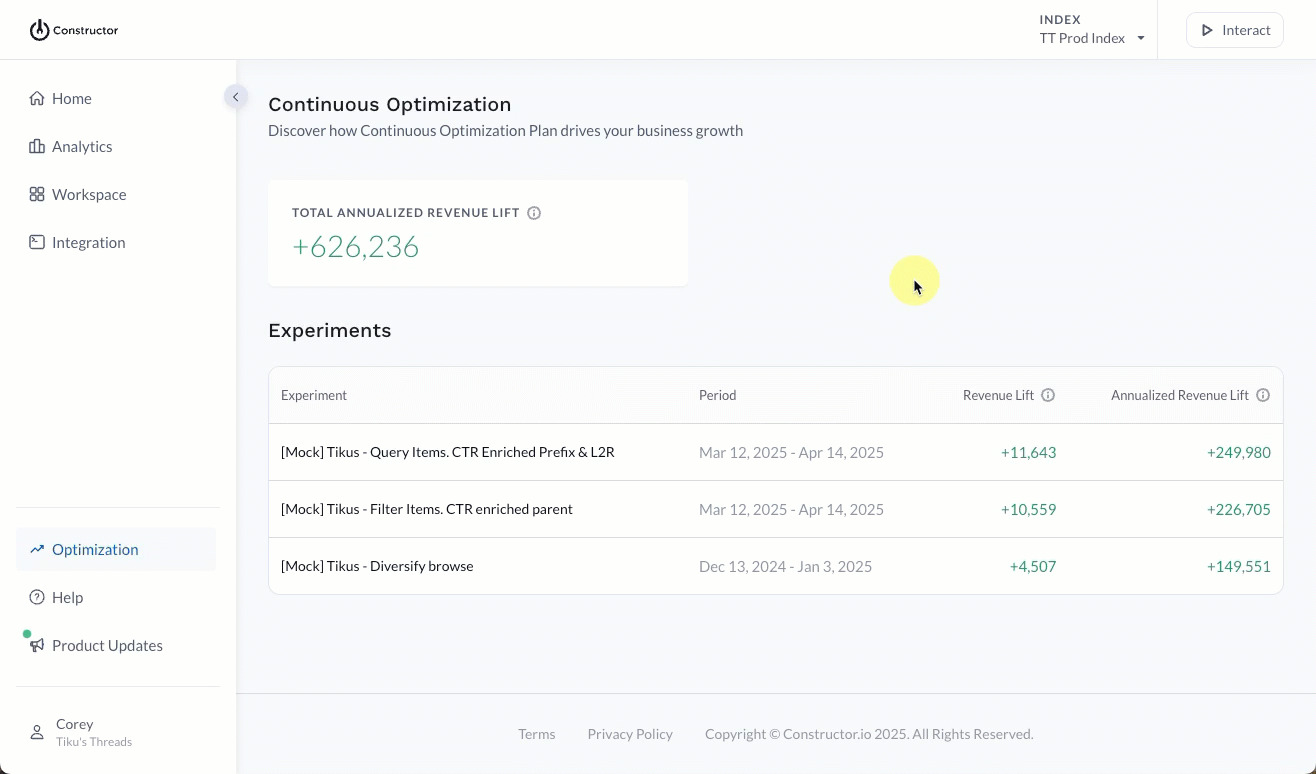
Access the Continuous Optimization dashboard
To access your Continuous Optimization dashboard, select Optimization in the side menu of the Constructor dashboard.
Total annualized revenue lift
This section displays the combined total annualized revenue from all completed experiments listed in the table. This reflects the total additional revenue generated by experiments since their start.
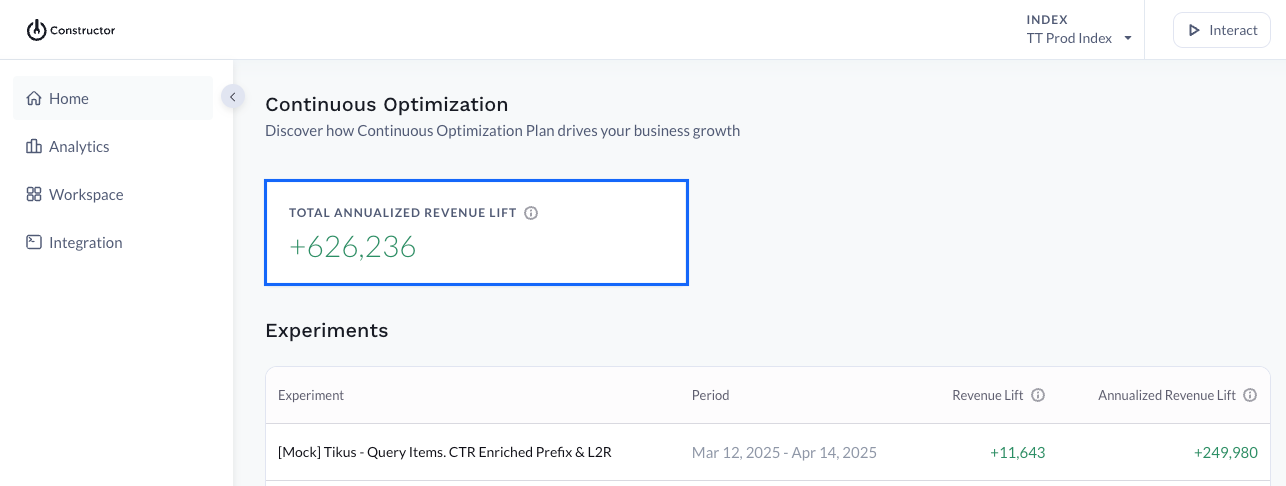
List of completed experiments
Your Continuous Optimization dashboard will list completed experiments. This allows us to determine the revenue and annualized revenue lift with confidence.
- Experiment: The name of the experiment. This will typically reference the feature variant being tested.
- Period: The time frame when the experiment ran.
- Revenue Lift: The additional revenue generated by this experiment when compared to the control group.
- This is calculated as Average revenue in test group**) - (Average revenue in control group)] (total # of users in both cells) / # of groups in the test.
- Annualized Revenue Lift: The projected annual revenue generated, based on the results. This value is normalized for a full year.
- This is calculated as Average revenue in test group**) - (Average revenue in control group)] (total # of users in both cells) / (number of days the test ran) * 365.
View experiment details
To learn more about a specific experiment, including the hypothesis and success metrics, select the experiment name. This launches a fly out on the left side of the page that contains more information about the experiment.
Experiment details
At the top of the fly out are key details about the experiment.

- Period: Time frame in which the experiment ran.
- Index: The name of the index where the experiment ran.
- User segment: Displays the name of any user segments applied in the experiment. These can be segments provided by a company, such as loyalty tiers or gender, or segments generated by Constructor.
- Behavioral filters: Displays any behavioral filters applied in the experiment. For example, for an experiment on search query results, adding the behavioral filter Users with at least one search query ensures the experiment includes relevant users and their behavior in the experiment.
Experiment revenue lift
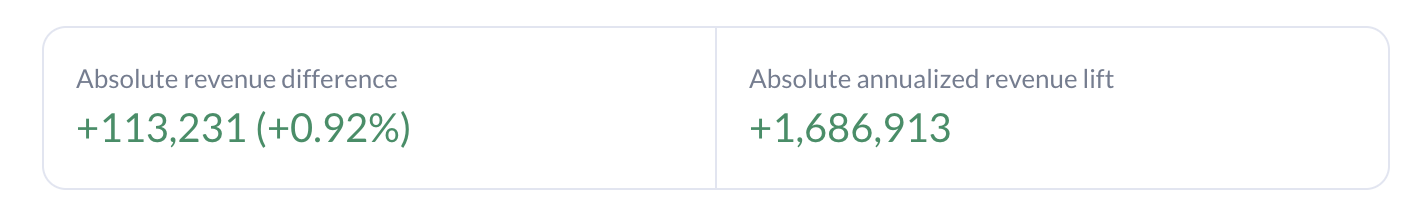
- Absolute revenue difference: Reflects the revenue difference between the control and test group in the experiment. This section also displays the lift as a percentage.
- This is calculated as e revenue in test group**) - (Average revenue in control group)] (*tot * (total # of users in both cells) / # of groups in the test.
- Absolute annualized revenue lift: Reflects the projected annual revenue generated if the tested change were applied to all users, normalized for a full year.
- This is calculated as e revenue in test group**) - (Average revenue in control group)] (*tot * (total # of users in both cells) / (number of days the test ran) * 365.
Hypothesis
Every experiment has a hypothesis, and these statements predict an experiment's expected outcome (i.e., “We expect improvements in product discovery and engagement metrics—such as browse clicks, add-to-carts, and conversion rate—driven by more accurate relevance estimation and better surface coverage of high-performing items”).
Select Show more, if present, to view the entire hypothesis.
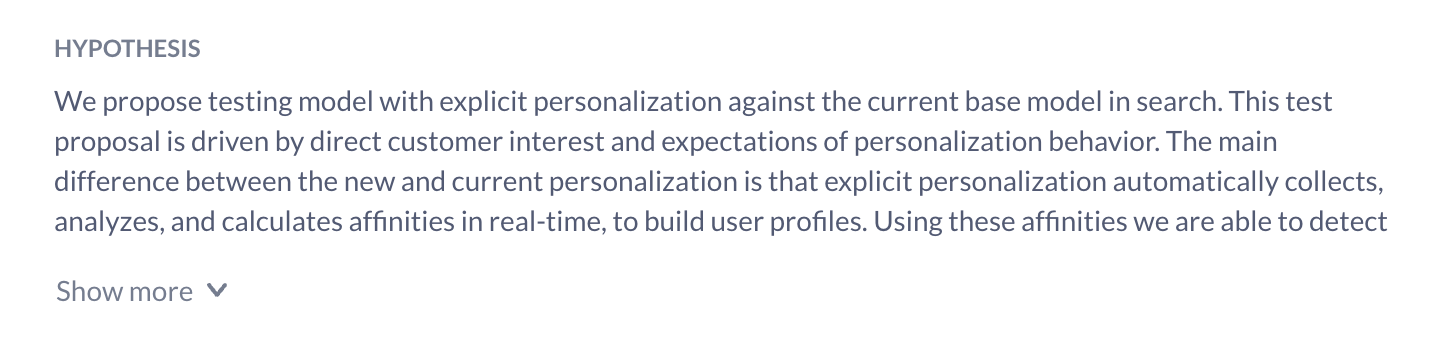
A hypothesis will contain:
- Information on what changes will be made to differentiate the control and text group experience
- An explanation of why we expect the feature variant to perform well for a company’s specific business needs
Success and guardrail metrics
This section of the fly out outlines the success and guardrail metrics used in the experiment.
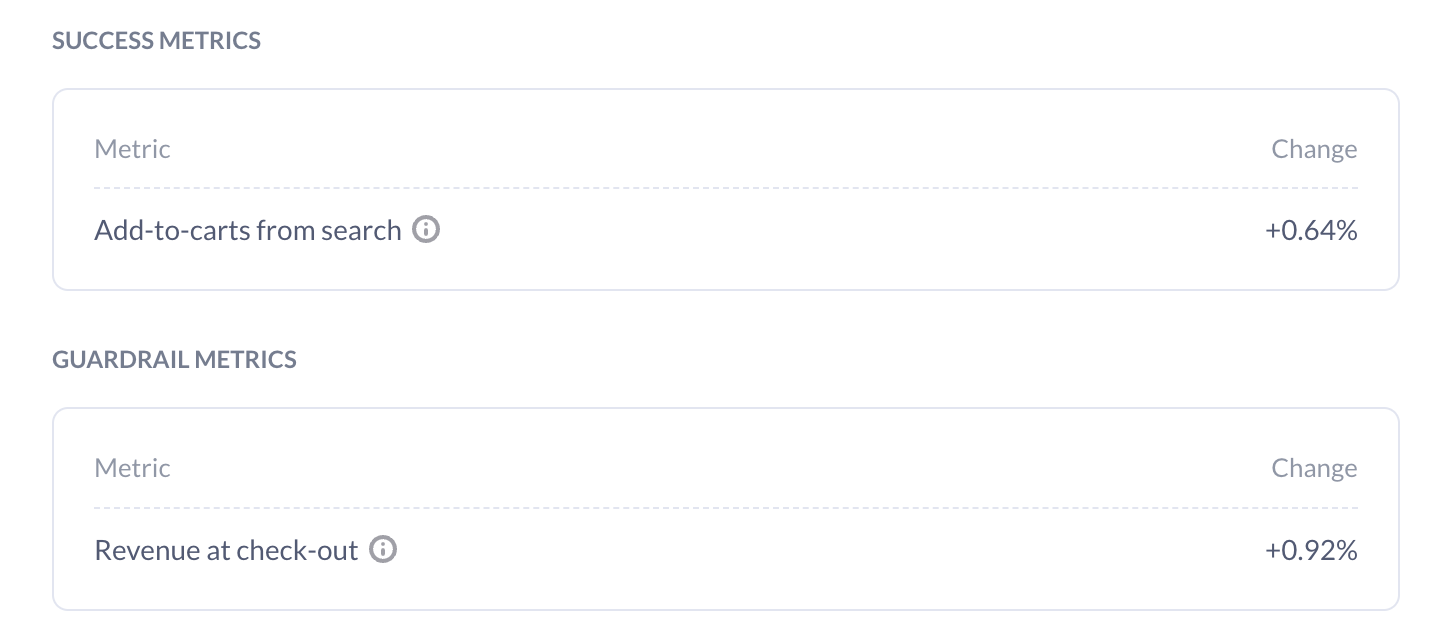
Success metrics
Success metrics are the primary metrics used to determine whether the experiment achieved its intended business or user impact. They directly measure the outcome that the hypothesis targets, and serve as the pass/fail criteria.
You can hover over a metric tool tip to view specifics for the metric. The Change column reflects the percentage increase in the specified business metric between the metric values in the test group and control group.
Guardrail metrics
Guardrail metrics are secondary metrics that ensure an experiment does not negatively impact critical aspects of business health or user experience while pursuing the primary goal. Essentially, they act as safety checks.
You can hover over a metric tool tip to view specifics for the metric. The Change column reflects the percentage increase in the specified business metric between the metric values in the test group and control group.
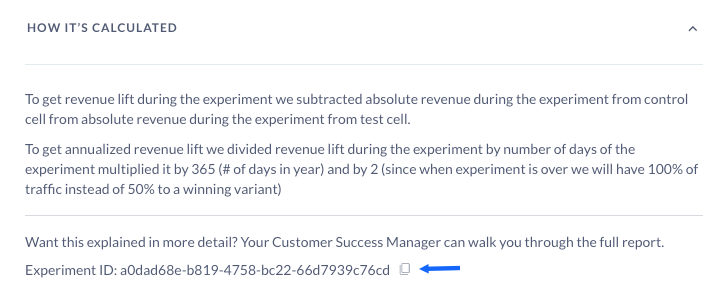
How it's calculated
Expand the How it's calculated section to view information on how Constructor calculates revenue lift and annualized revenue lift.
Additionally, if you want more information on the report, you can copy the Experiment ID using the copy icon and send that ID to your Customer Success Manager. They’ll provide you with a copy of the report and can discuss the findings with you.
Updated 10 months ago