Audience Hub
This feature is currently in beta.This feature is currently available to a small group of users. For more information on its broader release, please contact your Customer Success Manager.
Constructor’s Audience Hub is a company’s centralized command center for understanding and analyzing user behavior across a business. It provides a view of shoppers grouped by their shared preferences, along with their key performance metrics, including total users, revenue, purchase rate, and average order value (AOV).
By visualizing how different user segments perform over time, merchandisers can identify high-value shoppers, detect emerging trends, and make informed decisions to further optimize their experience both on and off-site
Navigate to Audience Hub
- Select Analytics in the side menu of the Constructor dashboard.
- Select Audience Hub.
Overall audience summary
The overall audience summary reflects site-wide analytics for the last 30 days. It appears at the top of the Audience Hub.
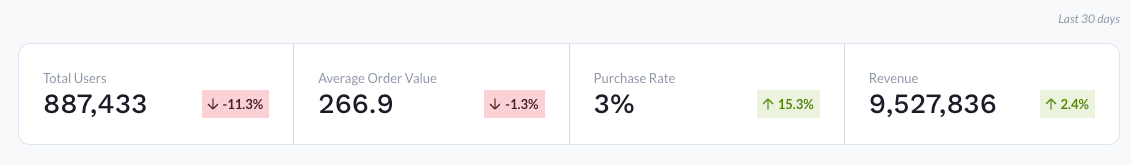
- Total users: Total number of users across your website in the last 30 days. This includes both new and returning users.
- Average order value: Total revenue for the last 30 days divided by the number of orders placed in the last 30 days. This is an average across your site.
- Average purchase rate: Percentage of total sessions where users purchased an item. This is an average across your site.
- Revenue: Overall revenue from items users purchased across your site in the last 30 days.
Segments
User segments divide your total audience into distinct groups, or segments, based on shared characteristics, learnings, and behaviors. This enables teams to gain a deeper understanding of their audience, identify potential issues, and create personalized experiences or targeted campaigns.
Constructor displays three types of segments:
- Smart segments: Segments generated by Constructor AI and customer learnings. Our team is working hard to deliver additional smart segments in the future.
- Geo and device segments: Segments created from knowledge of users’ location and device type.
- Customer-provided segments: Segments provided by the company. For example, a VIP segment.
Constructor regularly updates smart segments to include new users who meet the segment criteria.
You can navigate to different segment types by selecting the segment category at the top of the table.
Affinity segments
Affinity segments group users based on an affinity or preference for specific item attributes, such as color, brand, size, or style. Essentially, any attribute available as a facet within the metadata.
For example, a beauty retailer might have affinity segments based on users’ preference for skin tone (e.g., deep, light, medium deep) or brand, while a pet store might have affinity segments based on pet (e.g., dog, cat, bird, reptile) or food (e.g., wet, dry, freeze dried).
Since users often have a variety of preferences (i.e., they frequently purchase products from more than one beauty brand or buy food for both their dog and cat), they can therefore exist in multiple affinity segments.
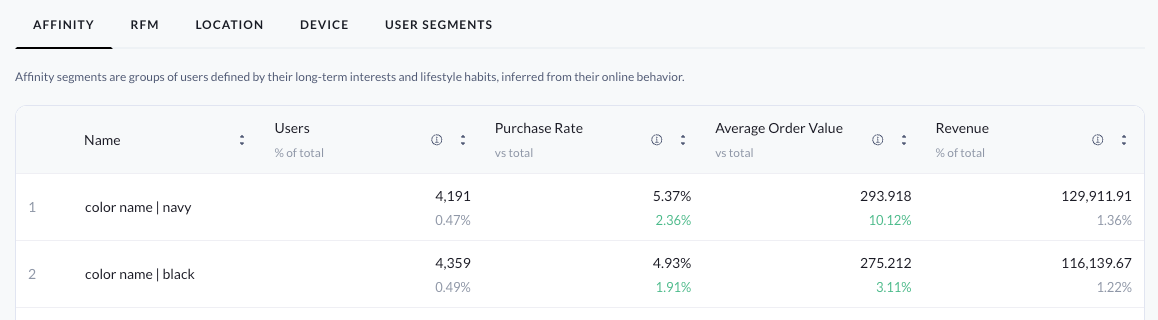
- Users: Number of users in a given segment. Users may have multiple sessions, but will only be counted once in the segment. Percentage reflects the segment size compared to all users site-wide.
- Purchase Rate: Percentage of segment sessions where a segment user purchased an item, compared to the overall site purchase rate.
- Average Order Value: Revenue generated by a segment divided by the number of orders placed by users in that segment, compared to the overall site Average Order Value.
- Revenue: Revenue generated by the user segment compared to the overall site revenue
RFM segments
RFM stands for Recency, Frequency, and Monetary value—three key factors that help companies understand their users’ behavior and value.
RFM segments group users based on how recently they’ve interacted with the site, how often they purchase or interact on the site, and how much they spend. These segments allow merchandisers to identify loyal customers, those at risk of churning, and new shoppers with growth potential.
RFM segments combine these factors to give a clearer picture of users’ behavior. For example, Engaged Non-Buyers | recent, high freq is a segment of users who have recently visited and frequently interact with a company’s website. On the other hand, Occasional Bargain Hunters | inactive, low freq, low $ are users who haven’t purchased recently and maybe only do so when there is a sale or clearance. Analyzing Constructor’s learnings for this segment could help a team develop a strategy to move some of those users into a more engaged segment willing to spend a little more.
⚠️ Please note: Anomalous Buyers are those we’ve identified as outliers. For example, if a user's frequency (of purchases) or monetary value is higher than that of 99.9% of users, they are classified as an Anomalous Buyer in an effort to remove noise from the rest of the RFM segments.
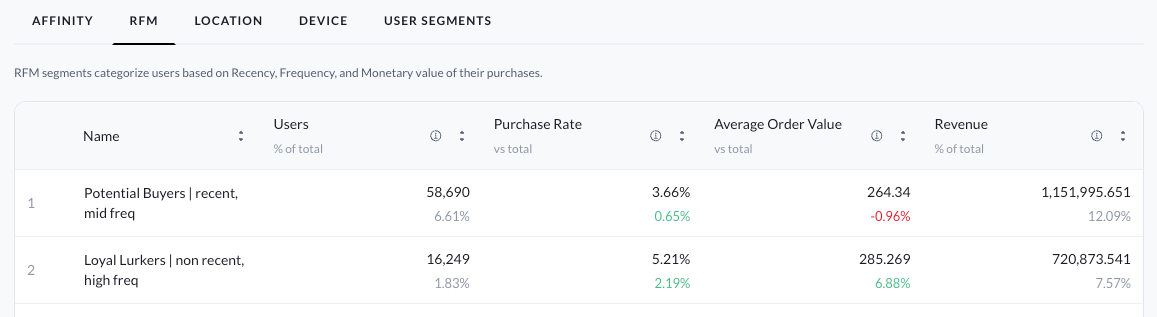
- Users: Number of users in a given segment. Users may have multiple sessions, but will only be counted once in the segment. Percentage reflects the segment size compared to all users site-wide.
- Purchase Rate: Percentage of segment sessions where a segment user purchased an item, compared to the overall site purchase rate.
- Average Order Value: Revenue generated by a segment divided by the number of orders placed by users in that segment, compared to the overall site Average Order Value.
- Revenue: Revenue generated by the user segment compared to the overall site revenue.
Location segments
Location segments group users based on where they are located. This makes it easy for teams to understand how customer behavior and performance differ across geographic areas, and to compare how these different regions contribute to overall business performance.
You can drill into specific locations by selecting the Country, Region, and City tabs at the top of the segment listing. Percentages listed beneath the metric reflect a comparison to the average site-wide value.
- Users: Number of users in a given segment. Users may have multiple sessions, but will only be counted once in the segment. Percentage reflects the segment size compared to all users site-wide.
- Purchase Rate: Percentage of segment sessions where a segment user purchased an item, compared to the overall site purchase rate.
- Average Order Value: Revenue generated by a segment divided by the number of orders placed by users in that segment, compared to the overall site Average Order Value.
- Revenue: Revenue generated by the user segment compared to the overall site revenue.
Device segments
Device segments group users based on the type of device they use to interact with a company’s website (e.g., mobile phone, desktop computers (PCs), tablets, etc.).
These segments help teams understand where users are coming from and how their experience or behavior differs depending on the device. This insight is especially valuable for improving your site experience, marketing campaigns, and conversion performance.
For example, a company notices that users on a PC have higher purchase rates and revenue than their mobile users. This prompts them to review their mobile site experience, where they discover the purchasing flow isn’t rendering correctly and or is unnecessarily tedious, likely deterring mobile users from completing purchases.
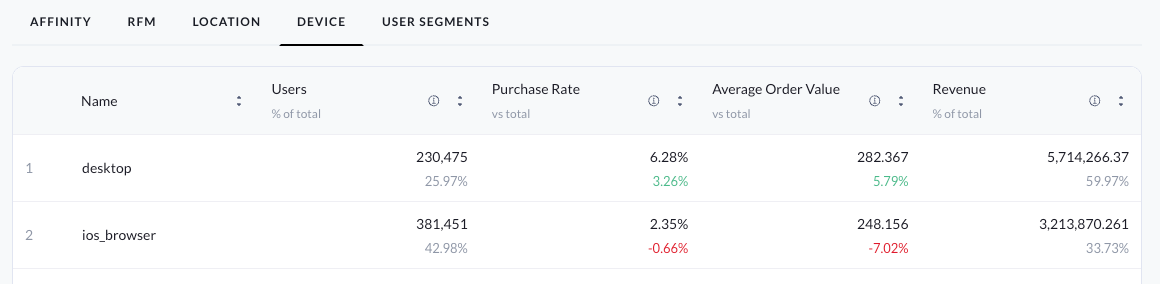
- Users: Number of users in a given segment. Users may have multiple sessions, but will only be counted once in the segment. Percentage reflects the segment size compared to all users site-wide.
- Purchase Rate: Percentage of segment sessions where a segment user purchased an item, compared to the overall site purchase rate.
- Average Order Value: Revenue generated by a segment divided by the number of orders placed by users in that segment, compared to the overall site Average Order Value.
- Revenue: Revenue generated by the user segment compared to the overall site revenue.
User segments
User segments are custom segments provided by a company. These segments allow teams to bring in customer groupings that are unique to their business, such as loyalty tiers, subscription members, or specific marketing campaign audiences.
For example, a beauty retailer might have different loyalty levels based on customers’ annual spend. Sending this segment to Constructor allows a team to see how these different segments perform across the different personalized experiences Constructor provides. It also allows merchandisers to create rules (e.g., boost, bury, slotting) for those specific tiers.
A team might also provide a segment with users who are part of a specific promotional or email marketing campaign. The team could then create specific rules for that segment that align with the campaign goal (e.g., a sale on a specific product type or brand) and then assess the campaign's effectiveness using the available metrics.
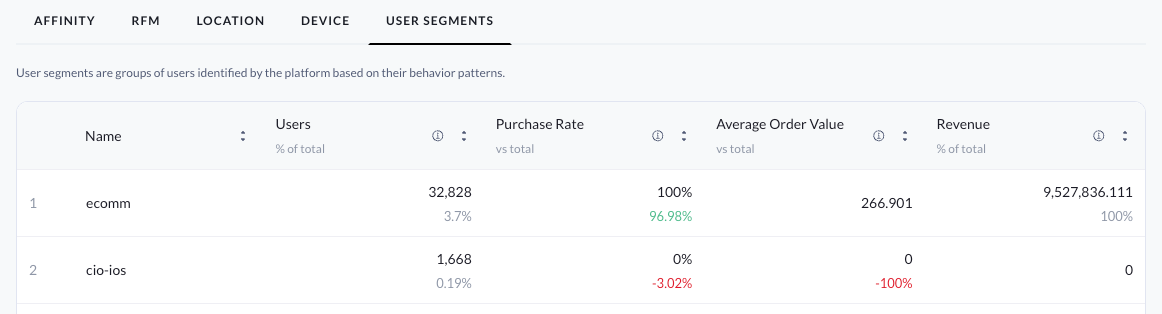
- Users: Number of users in a given segment. Users may have multiple sessions, but will only be counted once in the segment. Percentage reflects the segment size compared to all users site-wide.
- Purchase Rate: Percentage of segment sessions where a segment user purchased an item, compared to the overall site purchase rate.
- Average Order Value: Revenue generated by a segment divided by the number of orders placed by users in that segment, compared to the overall site Average Order Value.
- Revenue: Revenue generated by the user segment compared to the overall site revenue.
View segment details
From the Segments listing, you can drill into any segment to view additional segment details. To do so, select the Segment Name.
At the top of the fly out is a summary of the metrics displayed in the Segments table. Below that are additional learnings that Constructor has identified about users in the segment. This includes:
- Top search queries for this segment: View the top queries searched by users in the segment.
- Top items purchases: View the top items purchased by users in the segment.
- Top items added to cart: View the top items added to cart by users in the segment.
Impersonate a segment
With impersonation, merchandisers can view how personalization affects the ranking of items for specific user segments. Merchandisers can also view important details of a segment’s clickstream behavior and how that behavior impacts the ranking of results for search queries, browse categories, collections, and more.
Impersonating a segment takes merchandisers into Interact, a tool that allows them to engage with different factors of Constructor’s ranking algorithm and view the impact on how items are ranked on different results pages.
Before you can review results, however, you must choose a context (e.g., search query, category page, collection, etc.).
Jump to a top search query results page
- Select a segment from the options in the table.
- On the fly out, select Impersonate in the top-right corner.
- Select a Top search queries for [segment name] option from those listed.
- Within Interact, review items retrieved and ranked for this segment for the query you selected.
- To view details about an item score, select that score in the top-left corner of the item tile.
- Learn more about Constructor’s ranking algorithm here.
Impersonate segment in another results page
To impersonate the segment for non-top searches and additional contexts, follow the steps below.
- Select Interact in the top-right corner of the page.
- Select the results page you wish to view using the search query field or choosing a category, collection, or facet page from the options listed.
- Locate Personal attractiveness on the left side of the page and turn on the toggle.
- If an impersonated user or segment already appears, select ∫ beneath the toggle.
- Expand the Smart segments section on the left side of the fly out, then choose your desired category (e.g., By affinity or By RFM).
- Once you select the segment category, you can choose the specific segment.
- Last, select Impersonate in the top-right corner of the page.
Updated 6 days ago